
FIGURE 4.
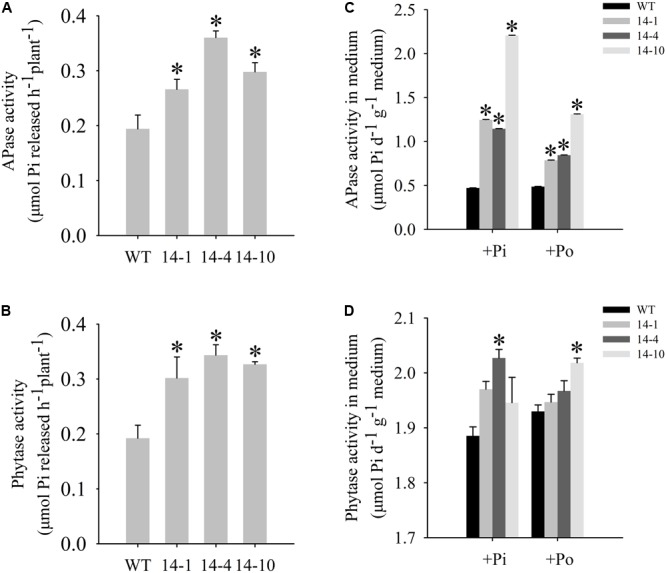
Measurement of secreted enzyme activities. (A,B) Secreted APase and phytase activities in the roots of transgenic plants (14-1, 14-4, and 14-10) and WT plants. 15-day-old seedlings from the Pi condition were transferred to 2-mL Eppendorf tubes containing 1.5 mL of a liquid medium supplemented with 1 mmol/L ρ-NPP or phytate. After being held for 1 day at 24°C, APase activity was measured at 410 nm. APase activity was expressed as ρ-NP released per hour per plant. Phytase activity was measured at 650 nm. Phytase activity was defined as Pi released per hour per plant. (C,D) APase and phytase activities in the medium of WT and transgenic plants. Transgenic and WT plants were sown on vermiculite under +Pi and +Po conditions. After 30 days of growth, the proteins were concentrated from the vermiculite, and enzyme activities were measured. The data are the mean ± SE (n = 5). Error bars represent the SE. Asterisks represent significant differences between transgenic and WT plants under the same condition (P < 0.05, t-test).