
Figure 3.
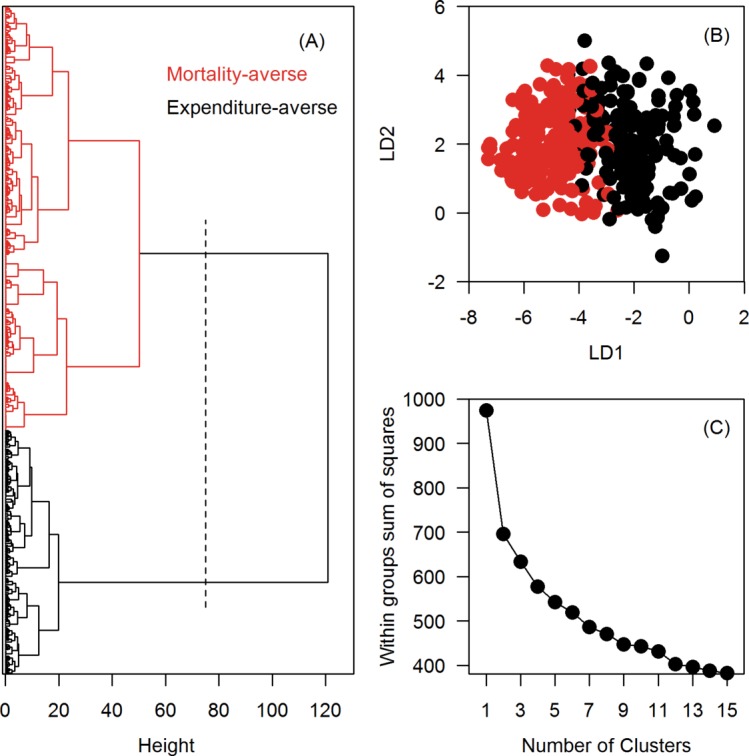
Identification of distinct respondent preference classes among 500 adult Singapore residents using a hierarchical cluster analysis. (A) A dendrogram of the hierarchical cluster analysis (Wald’s method). The x-axis measures the closeness of either individual points or clusters. (B) A centroid plot shows the first (linear discriminant (LD)1, x-axis) vs the second discriminant function (LD2, y-axis) from a two-group LD analysis. (C) An elbow plot validates the number of clusters. The ‘elbow’ on the line is at two clusters.