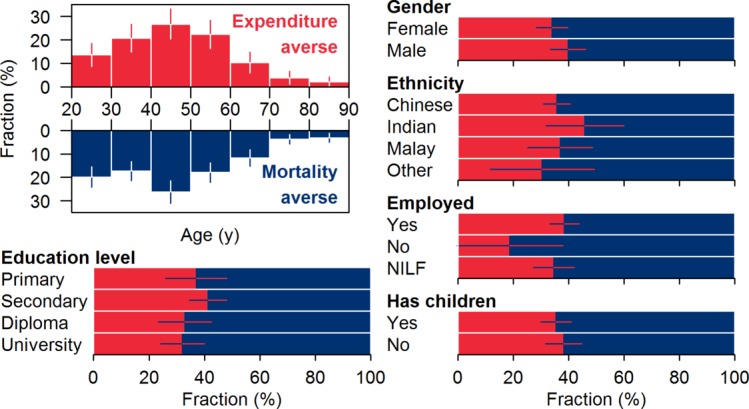
Figure 4.

Demographics of participants classified as expenditure averse (imperial red) and mortality averse (navy blue). Whiskers indicate 95% CIs. NILF, not in the labour force.

Demographics of participants classified as expenditure averse (imperial red) and mortality averse (navy blue). Whiskers indicate 95% CIs. NILF, not in the labour force.