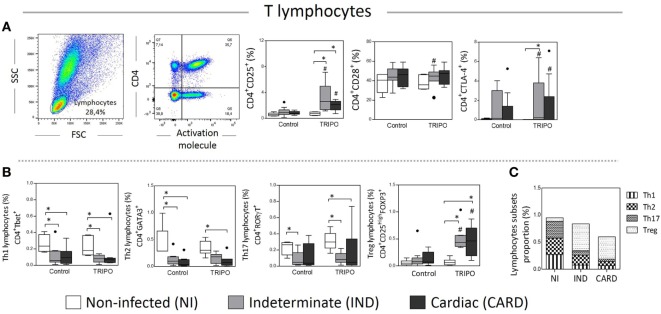
Figure 6.
Analysis of lymphocytes and subsets. Flow cytometry gate strategy of non-infected (NI) individuals is represented. Frequency of CD4+ lymphocytes expressing CD25, CD28, and CTLA-4 (A) in culture without stimulation (control) and after in vitro stimulation with T. cruzi antigens (TRIPO). Frequency of Th1, Th2, Th17, and T regulatory (Treg) lymphocytes subsets (B) and, proportion of lymphocyte subsets (C). The groups evaluated were NI individuals (n = 6), indeterminate (IND, n = 10), and cardiac (CARD, n = 9) clinical forms of Chagas disease. Significant differences (p < 0.05) between groups are evidenced by lines and asterisks (*) according Kruskal–Wallis test, followed by Dunn’s post hoc test. The # sign indicates the significant difference between control and TRIPO cultures using Wilcoxon signed-rank test. Boxes show the median and interquartile ranges, whiskers indicate the highest and lowest observation, and dots represent the outliers.

