
FIGURE 1.
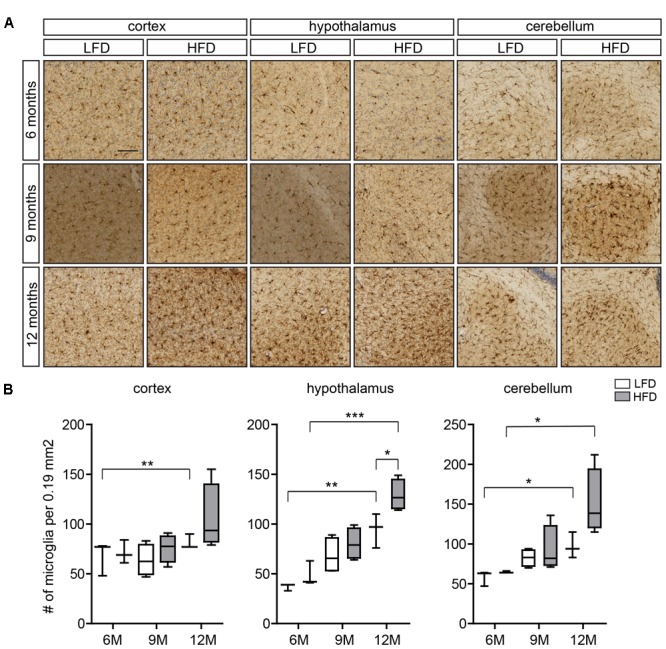
Microglia number in the cortex, hypothalamus, and cerebellum of HFD and LFD mice. (A) Representative images of brain sections of HFD and LFD mice at the indicated ages immunostained for Iba1, and counterstained with Cresyl violet. Iba1+ microglia in the cortex, hypothalamus, and cerebellum were analyzed. (B) The number of microglia was compared between HFD animals and LFD animals at the indicated ages. In both HFD and LFD mice, the number of microglia increased during aging. The number of microglia was significantly increased in the hypothalamus of 12-month-old HFD animals (n = 3 mice, gray boxes depict HFD samples, white boxes depict LFD samples, Student’s t-test, ∗p < 0.05, ∗∗p < 0.01, ∗∗∗p < 0.001). Scale bar: (A) = 100 μm.