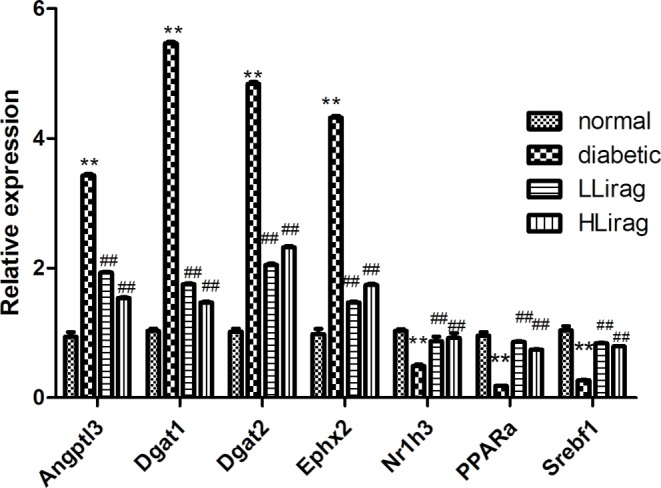
Figure 4. Confirmation of five representative differentially expressed genes by qPCR.

Values are mean ± S.D. (n=6), **P<0.01 compared with normal group; ##P<0.01 compared with diabetic group.

Values are mean ± S.D. (n=6), **P<0.01 compared with normal group; ##P<0.01 compared with diabetic group.