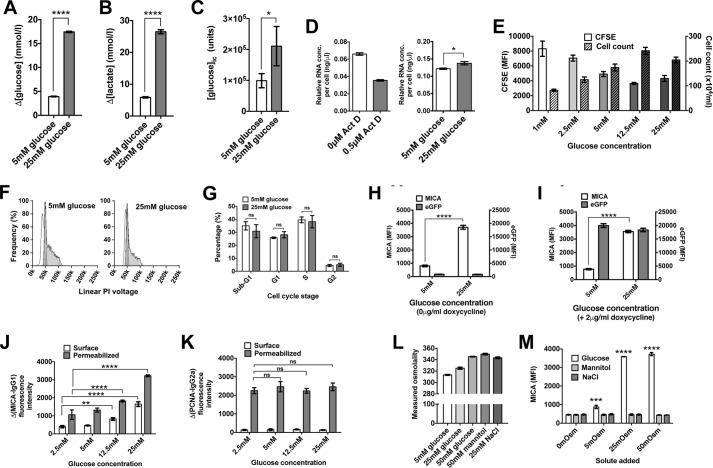
Figure 2.
Glucose restriction replicates quiescent to activated metabolism transition. A, 293T cells cultured in low (5 mm) glucose consumed less glucose than cells cultured in high (25 mm) glucose (p < 0.0001). B, lactate production was ∼4 times higher in cell cultured in high glucose compared with low glucose (p < 0.0001). C, intracellular glucose concentrations measured by nanoflow LC-MS were 2.13-fold higher in cells cultured in high glucose (p < 0.05). D, the RNA concentration per cell, reduced by culture with the RNA synthesis inhibitor actinomycin D (ActD), is 13% higher in cells cultured in 25 mm glucose compared with cells cultured in 5 mm glucose (p < 0.005). E, cellular proliferation measured by cell counting or CFSE dilution was maximal at intermediate glucose concentrations, unlike MICA expression. F, cell-cycle profiles were similar for cells cultured in 5 or 25 mm glucose. G, no significant difference was observed between cell-cycle phases in these conditions. H, MICA expression is induced by high (25 mm) glucose in cells transfected with inducible eGFP (p < 0.0001), but eGFP itself is not induced by high glucose. I, the induction of eGFP expression by doxycycline is equally efficient at low (5 mm) and high (25 mm) glucose. J, total cell MICA levels measured by flow cytometry of permeabilized cells is proportional to glucose concentration and cell-surface MICA. K, proliferating cell nuclear antigen (PCNA), used as a control for adequate permeabilization, is expressed independently of glucose concentration. L, glucose, mannitol, and sodium chloride each raise culture serum osmolality. M, change in culture medium osmolality does not affect MICA expression. Error bars, 95% confidence interval.

