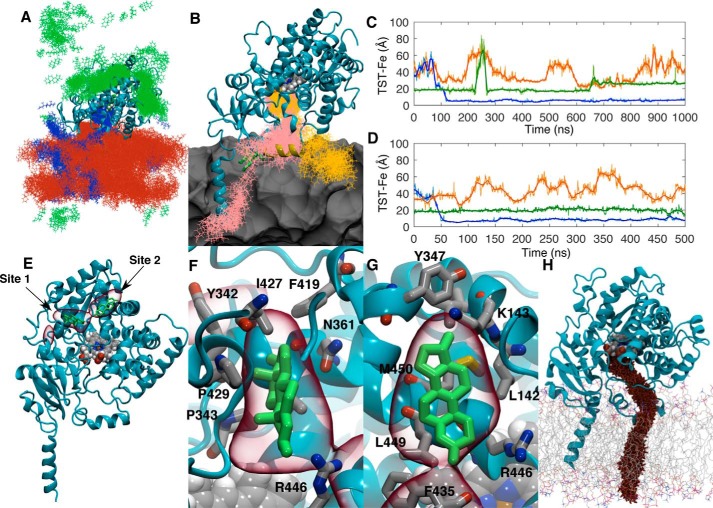
Figure 2.
A, distribution of TST molecules (green, blue, and orange) from one 0.5-μs aMD replica. Coordinate positions were recorded every 400 ps. B, snapshots of the two TST molecule positions (pink and orange lines) in the window surrounding their binding events. The POPC membrane is represented as a gray contour surface. C and D, distances between the TST centers of mass and the heme iron versus time for the two replicas where TST was observed to enter the CYP3A4 active site through the membrane. Solid lines represent a 30-ns moving average of the distances. E, volumetric map (red) illustrating the highest TST mass-weighted density over the 25 μs of aMD simulation. Representative TST positions from trajectory snapshots where it was observed to occupy these sites are illustrated in green. Both the TST positions and volumetric map are superimposed onto initial CYP3A4 geometry used in the aMD simulations. F and G, magnified views of the volumetric map highlighting the auxiliary TST-binding sites. H, representative cvSMD pathway for TST egress from CYP3A4.

