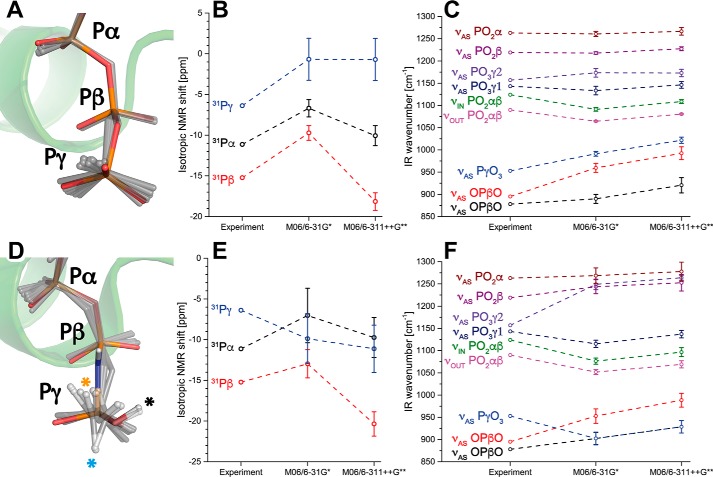
Figure 4.
NMR and infrared spectra for deprotonated and protonated GTP. A and D, geometries of (A) deprotonated and (D) γ-protonated GTP. Shown are the crystal structures of (A) Ras·GTP (1QRA.pdb) and (D) Ras·GppNHp (4RSG.pdb) in color and the dynamics of the substrate in the QM/MM optimized snapshots (gray sticks). The γ-GTP proton sampled the crystal structure (black asterisk), an O–Pγ–O–H torsion angle of 0° (orange asterisk) and 180° (cyan asterisk). B, calculated 31P NMR spectra match the experimental spectra for deprotonated GTP, with Pβ being most shielded, followed by Pα and Pγ, respectively. E, this was not the case for protonated GTP. C and F, the same applies for infrared spectra of deprotonated (C) and protonated (F) GTP. Therefore, GTP was most likely deprotonated in the experiments. Error bars depict the mean ± S.E. from each 15 independent calculations.

