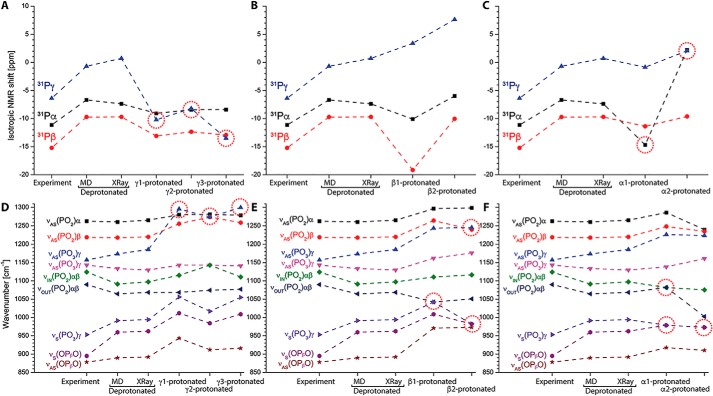
Figure 5.
NMR and IR spectra for GTP protonation on all possible sites. We calculated NMR and IR spectra for fully deprotonated phosphate groups and every possible protonation (γ1/γ2/γ3, β1/β2/, α1/α2; atom names match those in Fig. 1) of GTP bound to Ras (M06/6–31G*) from the crystal structure 1QRA.pdb. Results for deprotonated GTP and γ2 protonated GTP agree well to the values calculated from 15 QM/MM snapshots. Most significant deviations from experimental values are indicated by red circles. NMR spectra show significant deviations for γ protonation and α protonation. IR spectra show significant deviations for every kind of protonation, indicating fully deprotonated triphosphate was present in the experiments.

