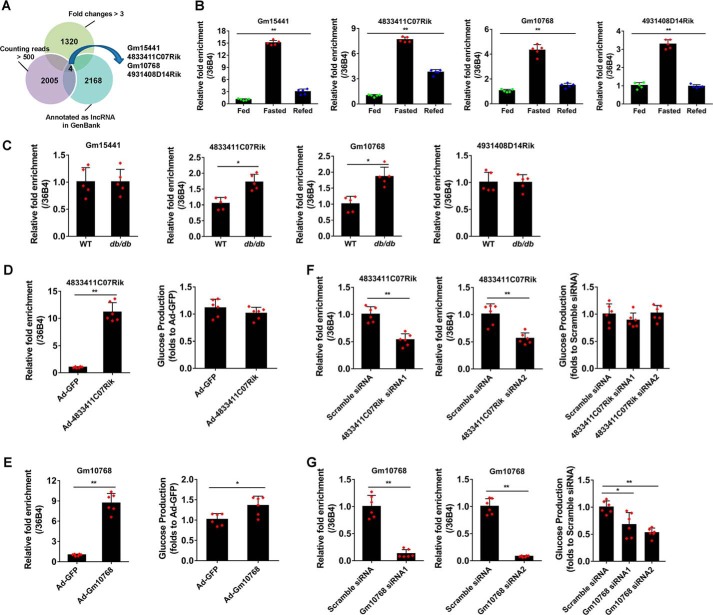
Figure 1.
Identification of Gm10768 as an inducible lncRNA during hepatic gluconeogenesis. A, cluster analysis was performed to screen out candidate lncRNAs potentially involved in hepatic gluconeogenesis in mice. The lncRNAs were selected based on three criteria: induction folds >3 during 16-h fasting, already annotated as authentic lncRNAs, and relatively high abundance in the mouse liver (counting reads >500). B, validation of four selected lncRNAs by RT-qPCR in the liver dissected from mice subjected to ad libitum feeding, 16-h fasting, or 16-h fasting followed by 8-h refeeding (n = 5 per group). **, p < 0.01, one-way ANOVA analysis. C, RT-qPCR analysis of four selected lncRNAs in the liver of WT or db/db mice (n = 5 per group). *, p < 0.05, and **, p < 0.01 versus WT, unpaired t test. WT, wildtype. D, RNA expression levels of 4833411C07Rik (left panel) and glucose output assay (right panel) in mouse primary hepatocytes infected with adenoviruses encoding 4833411C07Rik or GFP (m.o.i. = 50). **, p < 0.01 versus Ad-GFP, unpaired t tests. E, RNA expression levels of Gm10768 (left panel) and glucose output assay (right panel) in mouse primary hepatocytes infected with adenoviruses encoding Gm10768 or GFP (m.o.i. = 50). *, p < 0.05, and **, p < 0.01 versus Ad-GFP, unpaired t tests. F, RNA expression levels of 4833411C07Rik (left panel) and glucose output assay (right panel) in mouse primary hepatocytes transfected with siRNAs targeting 4833411C07Rik or Scramble siRNA. **, p < 0.01 versus Scramble siRNA, unpaired t test. G, RNA expression levels of 4833411C07Rik (left panel) and glucose output assay (right panel) in mouse primary hepatocytes transfected with siRNAs targeting Gm10768 or Scramble siRNA. *, p < 0.05, and **, p < 0.01 versus Scramble siRNA, unpaired t test. For D–G, mouse primary hepatocytes were isolated from six mice to perform one batch of experiments, and the cells were transduced with indicated adenoviruses or siRNAs for 48 h. Three batches of experiments were performed in total. Data were presented as mean ± S.D. Error bars represent the S.D. from the mean of three independent experiments.

