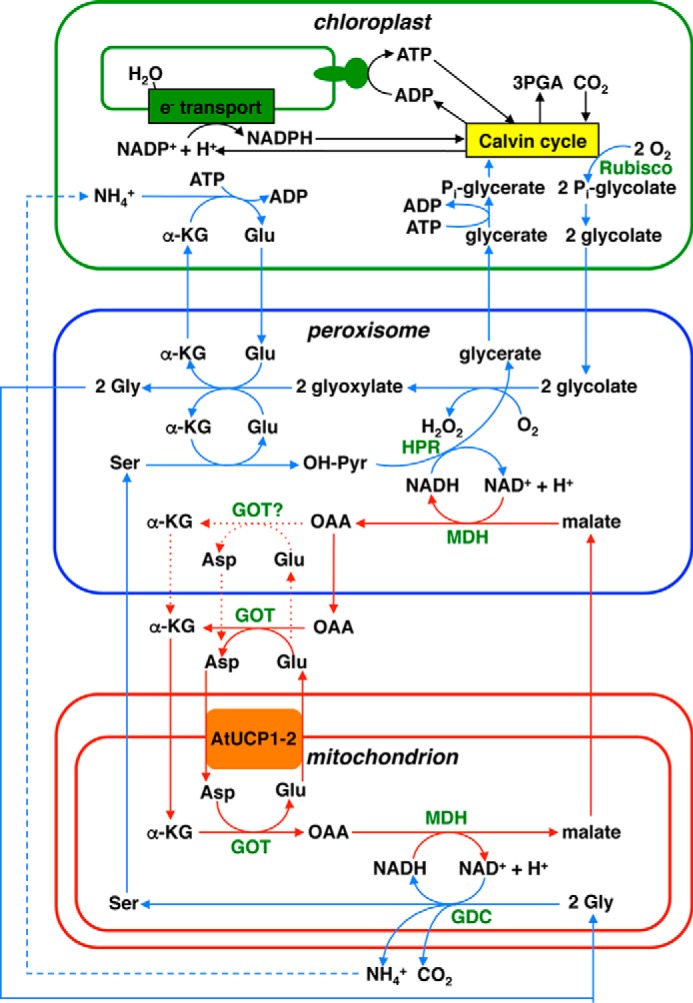
Figure 10.

Role of AtUCP1 and AtUCP2 in photorespiration. Blue and red lines with arrows indicate the flow of the glycolate pathway and the transport of reducing equivalents, respectively. Blue and red dashed lines with arrows indicate several transformation steps and alternative paths, respectively. The presence of GOT in the peroxisomes, which is uncertain, has been drawn. Compounds are abbreviated in black as follows. α-KG, α-ketoglutarate; OAA, oxaloacetate; OH-Pyr, hydroxypyruvate. Enzymes are abbreviated in green. GDC, glycine decarboxylate; GOT, glutamate oxaloacetate transaminase; HPR, hydroxypyruvate reductase; MDH, malate dehydrogenase. The figure is modified from Refs. 37 and 51.
