Figure 5.
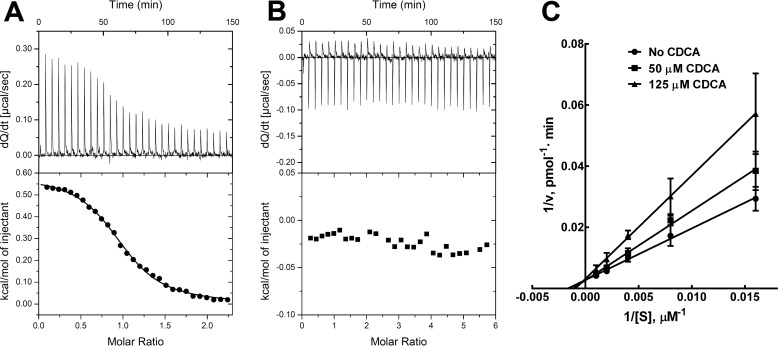
CDCA binds to Nudt19 but not to Nudt7. A and B, ITC binding curves of Nudt19 (A) and Nudt7 (B). The binding curves are representative of two or three independent experiments. C, graphical analysis of CDCA inhibition of Nudt19 using fixed concentrations of the inhibitor and variable concentrations of free CoA revealed that CDCA was competitive with free CoA. The data are reported as the mean of two independent experiments in duplicate ± S.D.

