. 2017 Sep 28;8(12):8301–8308. doi: 10.1039/c7sc03777e

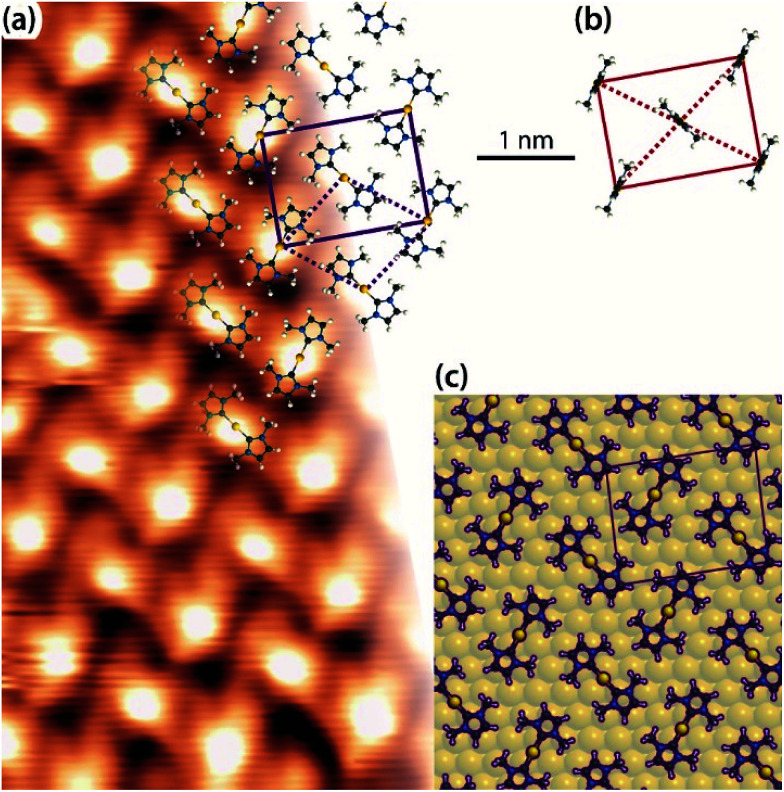
Fig. 5. (a) Zoom-in STM image of a saturation coverage of IMe on Au(111) (TSTM ∼ 155 K, Us = −1.79 V, It = 0.03 nA) overlaid with proposed molecular model of Au(IMe)2 analogous to the observations of Cu(IMe)2 on Cu(111) and Ag(IMe)2 on Ag(111). The solid lines indicate the overlayer unit cell and the dotted lines the Au adatom lattice. (b) Unit cell and top view of the previously proposed molecular model of the same assembly,12 drawn in the same scale as for our work. (c) Top view of DFT optimised geometry of Au(IMe)2 in the unit cell given by the epitaxy matrix deduced here (periodic unit cell of the calculation indicated in purple). C, N, H and Au atoms are represented by black, blue, white and yellow spheres, respectively. In the DFT model the Au(IMe)2 molecules are outlined for clarity.

Fig. 5