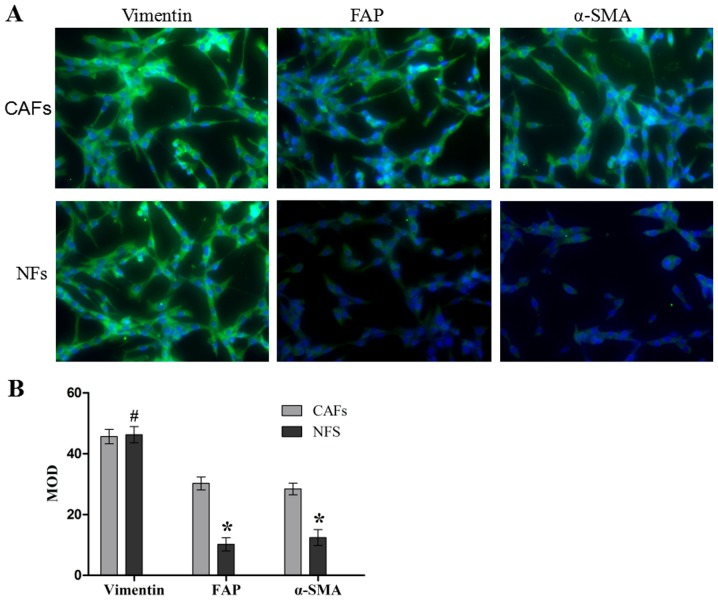
Figure 1.
Immunofluorescence assay analysis of vimentin, FAP and α-SMA in the CAFs and NFs. (A) Macroscopic immunofluorescence images of vimentin, FAP and α-SMA. (B) The MOD statistical results of vimentin, FAP and α-SMA. Data are presented as the mean ± the standard error of the mean of three independent experiments. #P>0.05 vs. CAFs group. *P<0.05 vs. CAFs group. MOD, medium optical density; CAFs, cancer-associated fibroblasts; NFs, normal fibroblasts; FAP, fibroblast activation protein; α-SMA, α-smooth muscle actin.

