Figure 1.

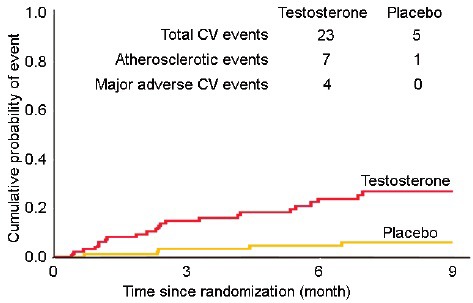
Cardiovascular events seen in the TOM Trial. The Kaplan–Meier plot shows divergence of the curves weeks after randomization (adapted from Basaria et al.29). TOM: Testosterone in Older Men with Mobility Limitation.

Cardiovascular events seen in the TOM Trial. The Kaplan–Meier plot shows divergence of the curves weeks after randomization (adapted from Basaria et al.29). TOM: Testosterone in Older Men with Mobility Limitation.