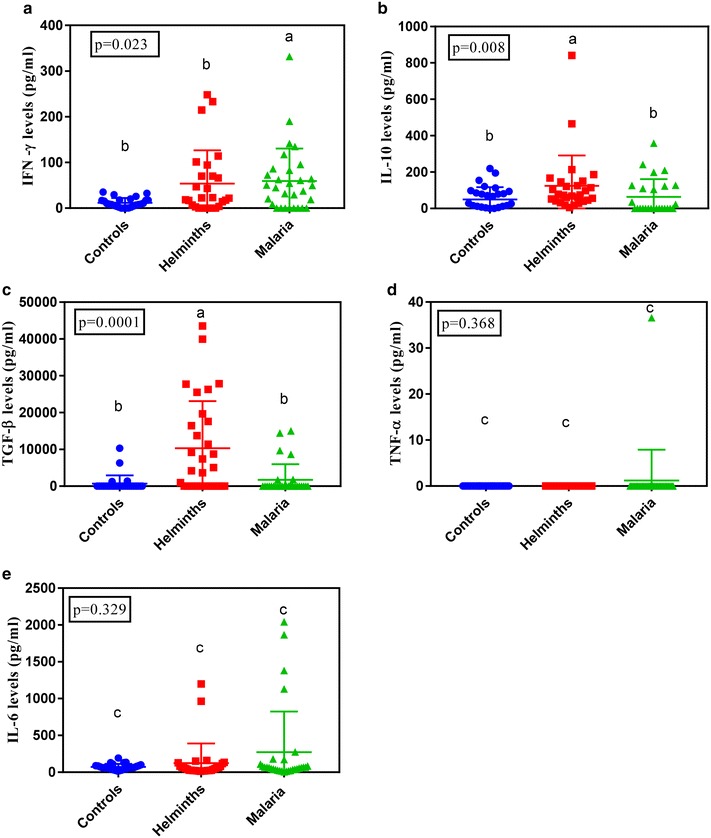
Fig. 1.

Plasma cytokine profiles in Plasmodium falciparum malaria cases, soil borne helminths and normal controls for IFN-γ (a), IL-10 (b), TGF-β (c), TNF-α (d) and IL-6 (e). Graphs show median level with interquartile range. Letters above the bars indicate significant difference between the groups (Dunn’s post-test, P ≤ 0.05)
