
Fig. 3.
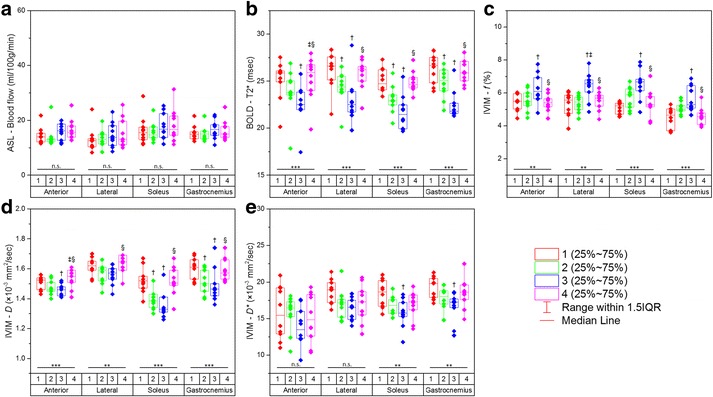
Graphs presenting serial measurements of imaging parameters from ASL (a), BOLD (b), and IVIM (c, d, e) for the anterior, lateral, soleus, and gastrocnemius muscle groups in healthy old subjects. Comparisons among all four statuses (1 = baseline; 2 = 20-mmHg cuff compression; 3 = 40-mmHg cuff compression; 4 = recovery) for every muscle group were performed using the Friedman test (n.s. = not significant; * = P < 0.05; ** = P < 0.01; *** = P < 0.001). Further pairwise comparisons were made with the Dunn test († = P < 0.05 compared with baseline; ‡ = P < 0.05 compared with 20-mmHg cuff compression; § = P < 0.05 compared with 40-mmHg cuff compression)