
Fig. 4.
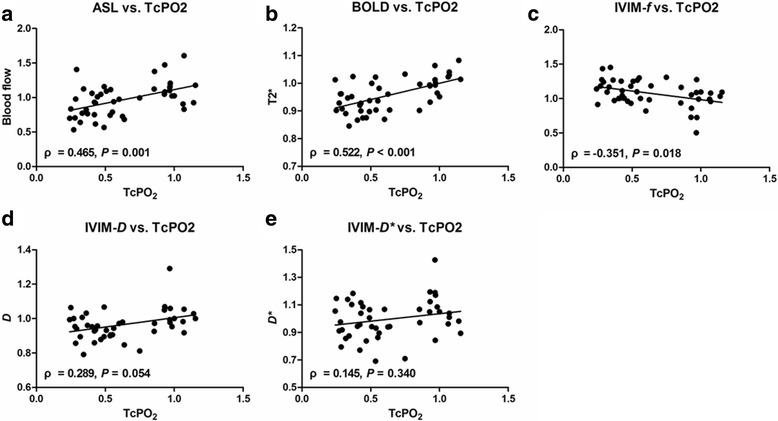
Graphs depicting relationships between normalized CMR imaging parameters of blood flow (a), T2* (b), f (c), D (d), and D* (e) and normalized TcPO2 measurements. Significant correlations were observed for (a), (b), and (c), with Spearman rank correlation coefficients (ρ) of 0.465, 0.522, and − 0.351, respectively