Figure 1.
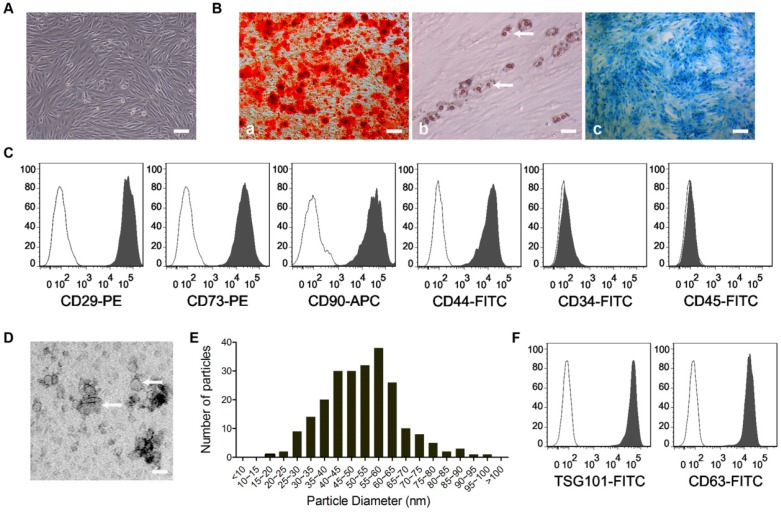
Identification of USCs and USC-Exos. (A) USCs showed a spindle-like morphology. Scale bar: 100 μm. When cultured in osteogenic, adipogenic or chondrogenic medium, USCs were able to differentiate into osteoblasts, adipocytes or chondrocytes, as evidenced by Alizarin Red S staining (B-a; Scale bar: 100 μm), Oil Red O staining (B-b; Scale bar: 50 μm) and Alcian Blue staining (B-c; Scale bar: 100 μm), respectively. White arrows indicate lipid droplets. (C) Flow cytometry analysis of the cell surface markers on USCs. The isotype controls are illustrated as blank curves and the test samples are illustrated as solid gray curves. (D) Morphology of USC-Exos under transmission electron microscopy. Scale bar: 50 nm. White arrows indicate exosomes. (E) The mean diameter of USC-Exos (51.57 ± 2.93 nm; n=232) was calculated from TEM images and the exosomes frequency was plotted for indicated size groups of 5 nm each. (F) Representative flow cytometry histograms showing the presence of exosomal surface markers CD63 and TSG101 on USC-Exos-bound beads (solid gray curves). Secondary antibody incubation alone served as the negative control (blank curves).

