Figure 6.
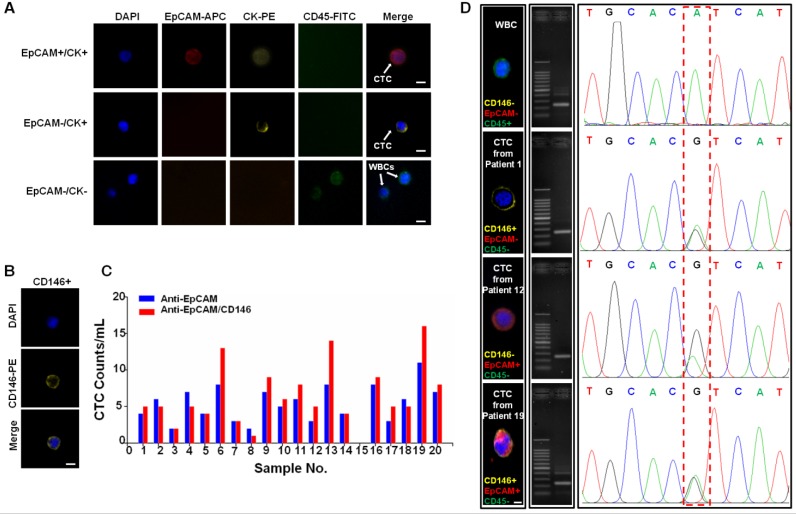
Capture and analysis of CTCs from the whole blood of cancer patients. (A) Fluorescence images of CTCs isolated from blood samples from a breast cancer patient. A four-color immunocytochemistry method based on DAPI nuclear staining, APC-anti-EpCAM, PE-anti-CK, and FITC-anti-CD45 was used to identify and enumerate CTCs. The scale bars are 10 μm. (B) Fluorescence images of a CTC from a breast cancer patient (#13), which is positive for CD146 and negative for EpCAM. The scale bar is 10 μm. (C) CTCs isolated from 2.0 mL blood samples from colorectal (#1-10) and breast (#11-20) cancer patients using anti-EpCAM/CD146 capture (red dots) and anti-EpCAM capture alone (blue dots) for comparison. (D) CTCs isolated from blood samples from colorectal and breast cancer patients. The scale bar is 5 μm. Middle: images of the amplified DNA of the single CTCs. Right: Sanger sequencing of the individually isolated cells. The 3140A/G (H1047R) point mutation in the PIK3CA oncogene was detected.

