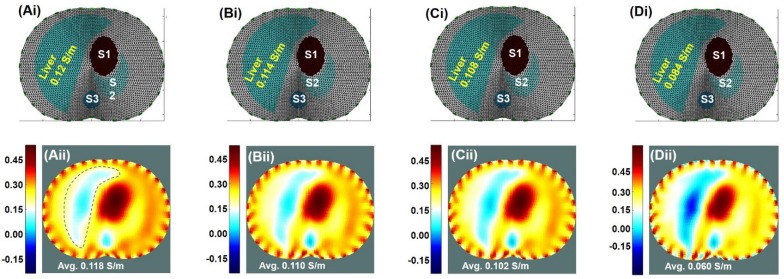
Figure 4.
Theoretical Simulation. Results were based on the EIT imaging algorithm in response to decremental conductivity values assigned to the liver; namely, 100%, 95%, 90%, and 80% of the baseline conductivity of 0.12 S/m, with the conductivity representing the variation in the fat content of the liver. (Ai-Di) The anatomic localization of the liver relative to other organs along an axial slice. S1: Stomach; S2: Spleen; S3: Spine. (Aii-Dii) EIT simulated the corresponding images undergoing decremental conductivity.

