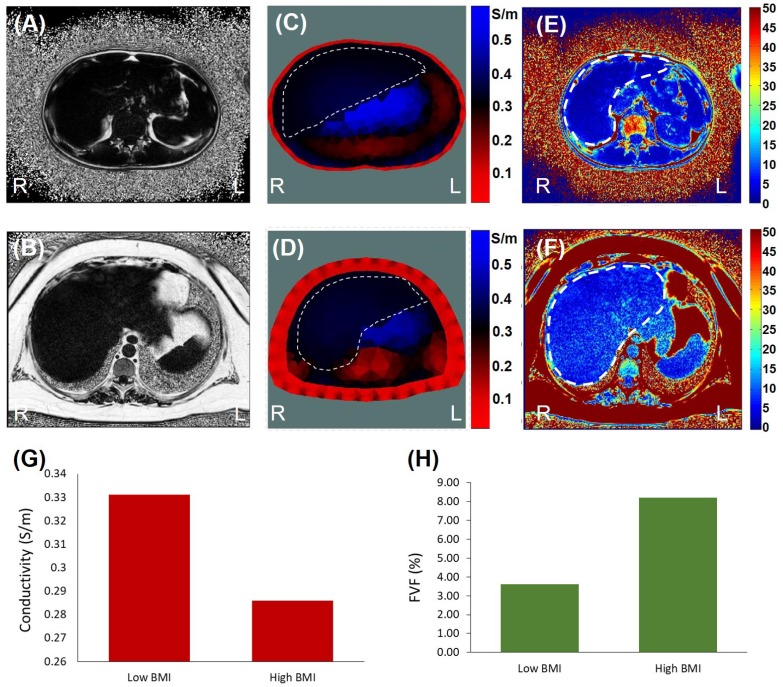
Figure 7.
EIT vs. MRI Fat Volume Fraction. Images were collected from the low (top row) and high BMI subjects (bottom row). (A & B) are the representative MRI images from the two subjects. (C & D) The corresponding EIT images were compared between low and high BMI. (E & F) The computed FVF values were also compared with the EIT measures. (G) Bar graph demonstrating a decrease in conductivity in the high BMI subject. (H) Bar graph demonstrating an increase in FVF value in the high BMI subject.

