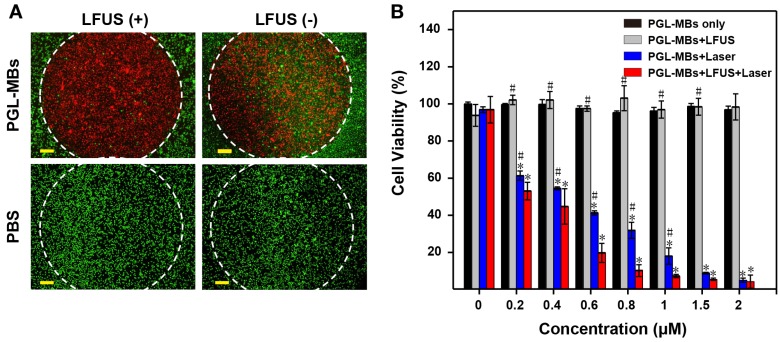
Figure 4.
Evaluation of PDT efficacy by cell assays. (A) Calcein-AM/PI staining (merged images) observed by fluorescence microscopy (×10, scale bar = 100 μm). The cells were treated with PGL-MBs (containing 1 μM PGL) or PBS with or without LFUS exposure (400 kPa, 3 min). Laser irradiation (650 nm, 200 mW/cm2) was only in the circular regions marked by white dotted lines. Green channel: CaM staining. Red channel: PI staining. (Scale bar: 100 μm) (B) Cell viability of PC-3 cells under different treatments with increasing concentration of PGL using CCK-8 assay. (*P < 0.05 versus PGL-MBs only, #P < 0.05 versus PGL-MBs+LFUS+Laser)

