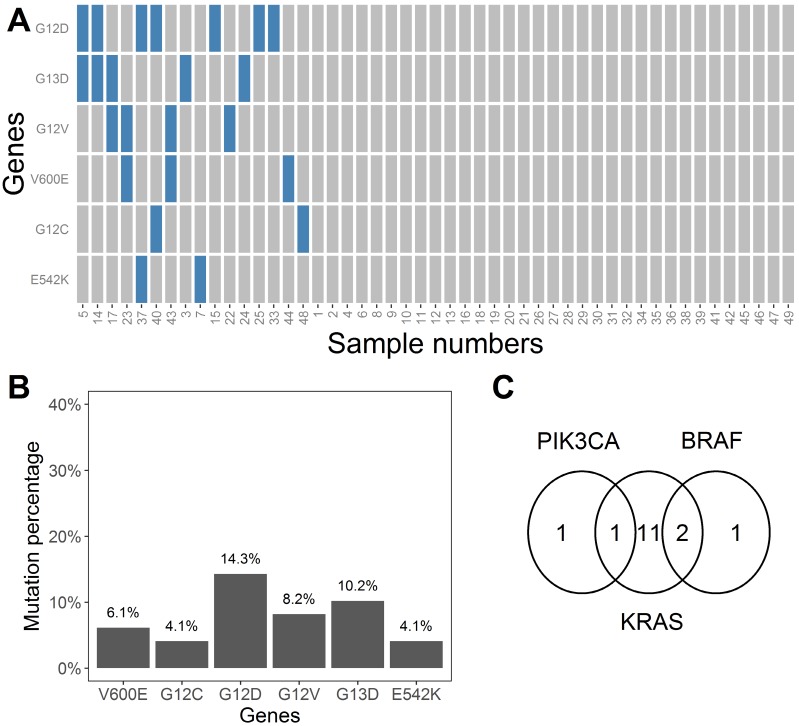
Figure 6.
A) Heatmap indicating states of six mutation types for all 49 plasma samples. Blue and gray rectangles represent the existence or non-existence of certain mutations, respectively. B) Mutation percentages for the six mutations (V600E, G12C, G12D, G12V, G13D, and E542K) in the 49 plasma samples. C) Venn diagram showing the occurrence and overlap of the mutations at BRAF, PIK3CA, and KRAS

