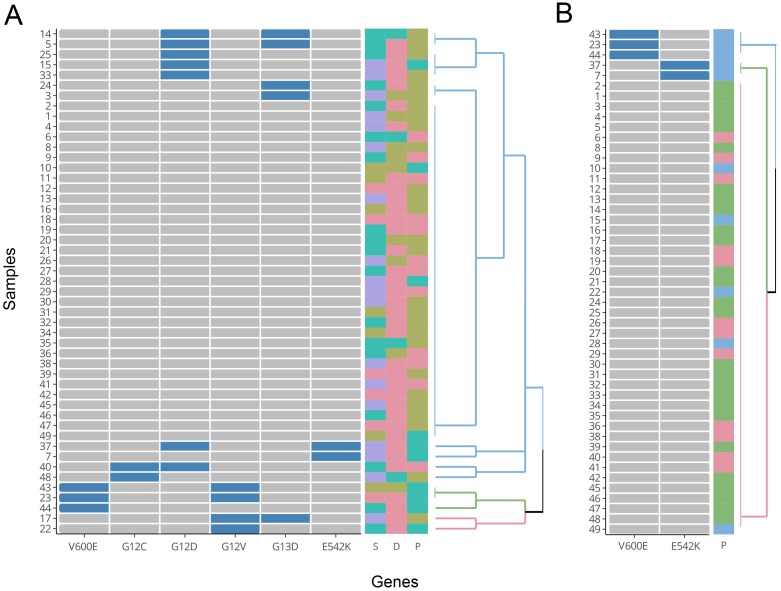
Figure 7.
Results of HCA. A) Cluster drawn by all six mutation types (with groupings of TNM stages, differentiation, and cancer position shown on the right). B) Cluster drawn by mutations of V600E and E542K (with grouping of cancer position shown on the right). D: differentiation (poor: brown; moderate: red; well: cyan). S: TNM stages (I: red; II: brown; III: cyan; IV: purple). P: cancer position (left colon: red; right colon: cyan; rectum: brown).

