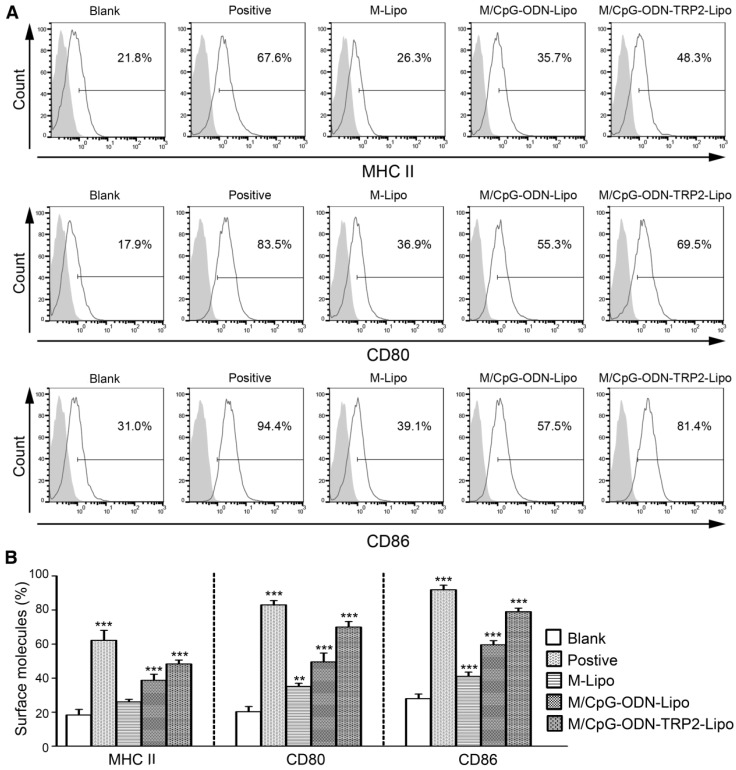
Figure 4.
M/CpG-ODN-TRP2-Lipo treatment induced higher levels of MHC II, CD80, and CD86. (A) The levels of MHC II, CD80 and CD86 expression were measured by flow cytometry. (B) Quantitative analysis. Data are expressed as mean ± SD of each group (n = 3). Untreated DCs served as a blank control. DCs treated with TNF-α served as a positive control. * p < 0.05, ** p< 0.01, *** p < 0.001.

