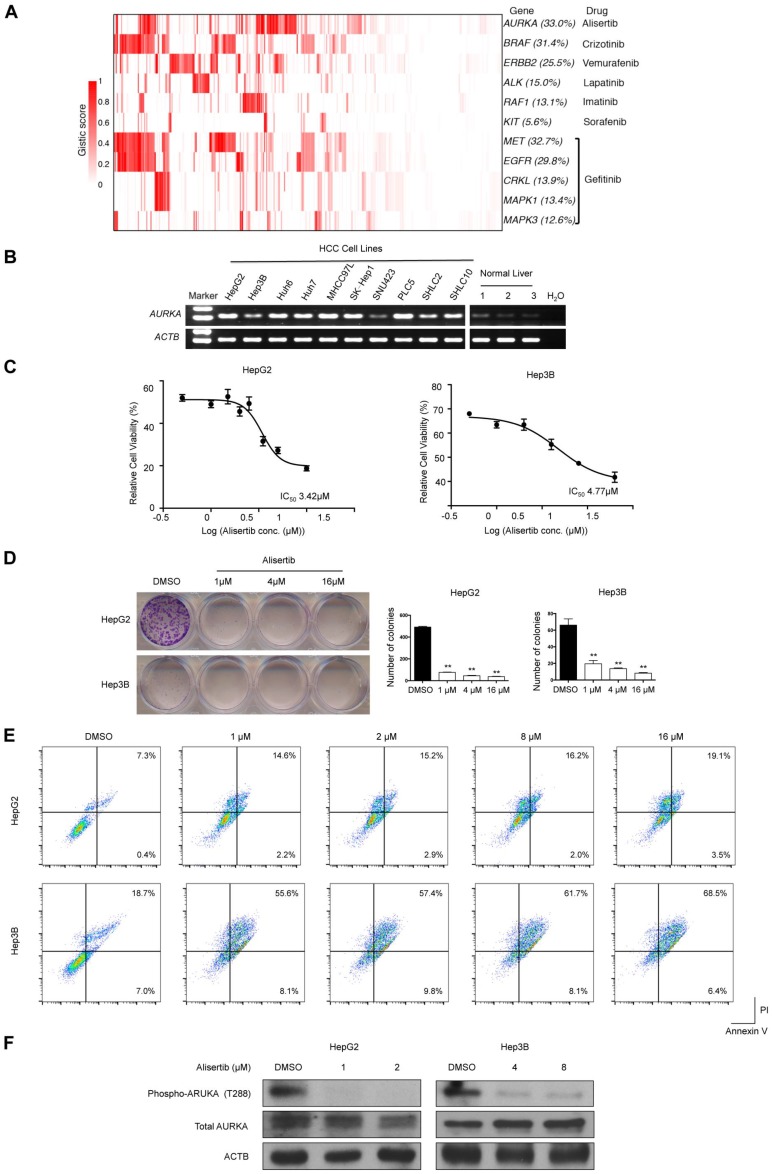
Figure 6.
Amplified druggable targets and experimental validation of AURKA. (A) Heatmap representation of amplified druggable targets and corresponding inhibitors are shown. (B) Semi-quantitative PCR was performed to detect AURKA mRNA levels in HCC cell lines and normal liver tissues. ACTB was used as internal control. (C) HepG2 and Hep3B cells were exposed to varying concentrations of alisertib for 48 h. Cell viability was assessed by MTT analysis. Inset: IC50 values of alisertib in HepG2 and Hep3B cells. (D) Colony formation assay of HepG2 and Hep3B cells treated with varying concentrations of alisertib for 48 h. (E) Apoptosis was detected by flow cytometric analysis of HCC cells double-stained with 7-AAD and annexin V. Percentages of apoptotic cells (the lower and upper right quadrants) are indicated. (F) Western blot analysis of phosphorylation of AURKA at T288, total AURKA and ACTB. Data are presented as mean ± SEM of at least three independent experiments. *p < 0.05; **p < 0.01, significantly different from control.

