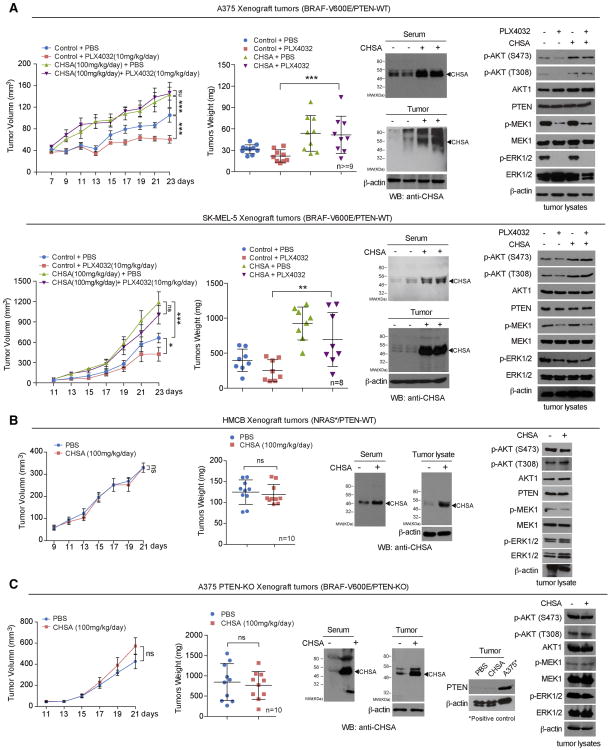
Figure 2. CHSA specifically promotes tumor growth and confers drug resistance to BRAF V600E/PTEN expressing melanoma cells.
(A-B) Xenograft tumor growth and tumor weight (left 2 panels), CHSA level in mice serum and xenograft tumor (middle upper and lower panels, respectively), and Western blot of tumor lysates showing AKT, MEK1, and EKR1/2 phosphorylation (right) in nude mice inoculated with human melanoma BRAF V600E-positive A375 (A, upper panels) and SK-MEL-5 (A, lower panels) cells, or NRAS-Q61K HMCB cells (B) and fed with CHSA with or without BRAF-V600E inhibitor as indicated.
(C) Xenograft tumor growth and tumor weight (left 2 panels), CHSA level in mice serum and xenograft tumor (middle panels), and Western blot of tumor lysates showing PTEN knock out status, AKT, MEK1, and EKR1/2 phosphorylation in nude mice inoculated with BRAF V600E-positive A375 cell line with PTEN CRISPR/Cas9 knockout.
Data are representative of two experimental replications. For (A-D), data reflect a single cohort experiment (A, upper: n >=9 tumors from 5 mice per group, lower: n=8 tumors from 5 mice per group; B, n=10 tumors from 5 mice per group; C, n=10 tumors from 5 mice per group.) Data are mean ± SEM for tumor growth and mean ± s.d. for tumor weight; p values were obtained by a two-way ANOVA test for tumor growth rates and a two-tailed Student's test for tumor masses (*0.01 < p < 0.05; **0.001 < p < 0.01; ***p<0.001; ns, not significant).
See also Figure S2.

