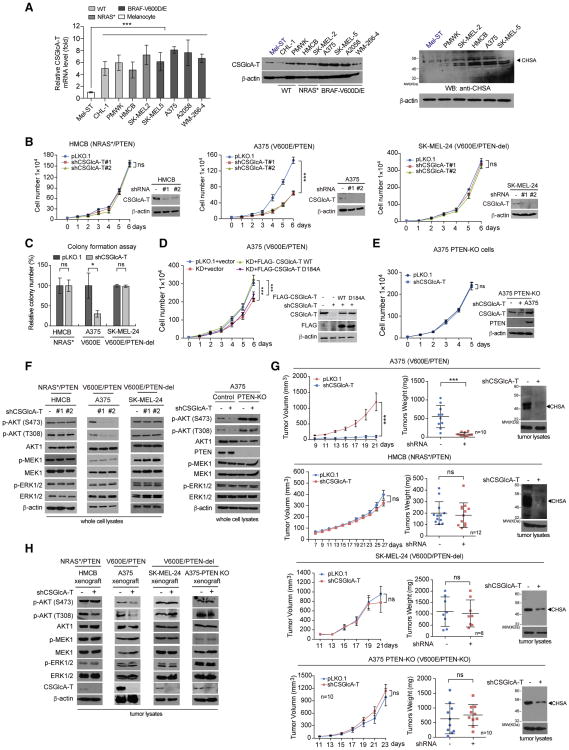
Figure 3. CSGlcA-T knockdown attenuates CHSA production and selectively inhibits BRAF V600E-dependent melanoma cell transformation in the presence of PTEN.
(A) Real time PCR and Western blot results showing the mRNA and protein level of CSGlcA-T (left and middle, respectively) and Western blot results showing CHSA level in multiple melanoma cell lines comparing with normal melanocyte Mel-ST cells (right).
(B) Effect of CSGlcA-T knockdown on proliferation rates of melanoma HMCB cells harboring NRAS Q61K (left), A375 cells harboring BRAF V600E (middle), or BRAF V600E SK-MEL-24 cells with PTEN deletion (right). Insets: Western blots showing the CSGlcA-T knockdown efficiency in each cell line.
(C) Effect of CSGlcA-T knockdown on monolayer colony formation of diverse melanoma cells including PTEN-expressing NRAS Q61K HMCB cells, BRAF V600E A375 cells, and BRAF V600E SK-MEL-24 cells with PTEN deletion.
(D) Rescue effect of CSGlcA-T knockdown with overexpression of FLAG-tagged wild type CSGlcA-T or mutant enzyme-dead D184A on cell proliferation rates of BRAF V600E melanoma A375 cells.
(E) Effect of CSGlcA-T knockdown on cell proliferation rates of BRAF V600E-positive A375 cell line with PTEN knockout.
(F) Western blot showing effects of CSGlcA-T knockdown on AKT, MEK1, and EKR1/2 phosphorylation in HMCB, A375, SK-MEL-24, and PTEN knockout A375 cells (left to right panels, respectively).
(G) Effect of CSGlcA-T knockdown on xenograft tumor growth (left), tumor weight (middle), and tumor CHSA levels (right) in nude mice inoculated with melanoma BRAF V600E-positive A375 and NRAS Q61K HMCB cells (upper panels), or BRAF V600E-positive SK-MEL-24 cells with PTEN deletion and A375 PTEN knockout cells (lower panels).
(H) Western blot showing AKT, MEK1, and ERK1/2 phosphorylation in tumor lysates obtained from xenograft tumors with CSGlcA-T knockdown.
Data are representative of two experimental replications for (A) and (D), and three experimental replications for (B, C, E, F and H). For (G), data reflect a single cohort experiment (A375 xenograft: n=10 tumors from 12 mice; HMCB xenograft: n=12 tumors from 12 mice; SK-MEL-24 xenograft: n=8 tumors from 12 mice; A375 PTEN-KO xenograft: n=10 tumors from 12 mice.) Data are mean ± SEM for tumor growth and mean ± s.d. for tumor weight; p values were obtained by a two-way ANOVA test for tumor growth rates and a two-tailed Student's test for tumor masses (*0.01 < p < 0.05; **0.001 < p < 0.01; ***p<0.001; ns, not significant). For RT-PCR, cell proliferation and colony formation, error bars indicate ± s.d. of three technical replicates.
See also Figures S3-S4.

