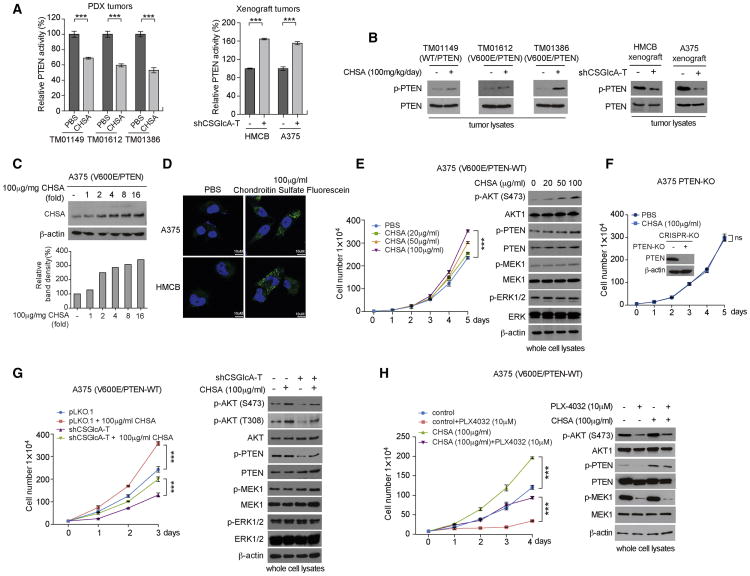
Figure 5. CSGlcA-T signals through CHSA to inhibit PTEN.
(A) Effect of CHSA treatment on PTEN activity in engrafted PDX tumor tissues from NSG mice fed with PBS or CHSA (left) and xenograft tumors of HMCB and A375 cells with or without CSGlcA-T knockdown (right).
(B) Western blot showing the effect on PTEN phosphorylation in PDX tumor tissues from NSG mice fed with PBS or CHSA (left 3 panels) and xenograft tumors of HMCB and A375 cells with CSGlcA-T knockdown (right 2 panels).
(C) Western blot showing the intracellular CHSA level following treatment with increasing concentrations of CHSA in A375 cells (upper). Lower panel shows quantification of the Western blotting.
(D) Confocal imaging results showing the uptake of fluorescein-labelled chondroitin sulfate into the cytosol of HMCB and A375 melanoma cells. Scale bars represent 10 μM.
(E) Effect of increasing treatment dosage of CHSA on cell proliferation rate (left) and phosphorylation level of AKT and PTEN (right) in BRAF V600E A375 melanoma cells.
(F) Effect of CHSA treatment on cell proliferation rate in A375 melanoma cells with PTEN knockout. Inset: Western blot showing the knockout efficiency of PTEN in A375 cells.
(G) Rescue effect of CHSA treatment on cell proliferation rate (left) and phosphorylation level of AKT and PTEN (right) in A375 cells with or without stable knockdown of CSGlcA-T.
(H) Rescue effect of CHSA treatment on cell proliferation rate (left) and phosphorylation level of AKT and PTEN (right) in A375 cells in the presence or absence of BRAF V600E inhibitor PLX4032.
Data are representative of three experimental replications for (A) and two experimental replications for (B-H). Error bars indicate ± s.d. of three technical replications, p values were obtained by a two-tailed Student's test for (A) and a two-way ANOVA test for (E-H) (***p<0.001; ns, not significant).
Also see Figure S6.

