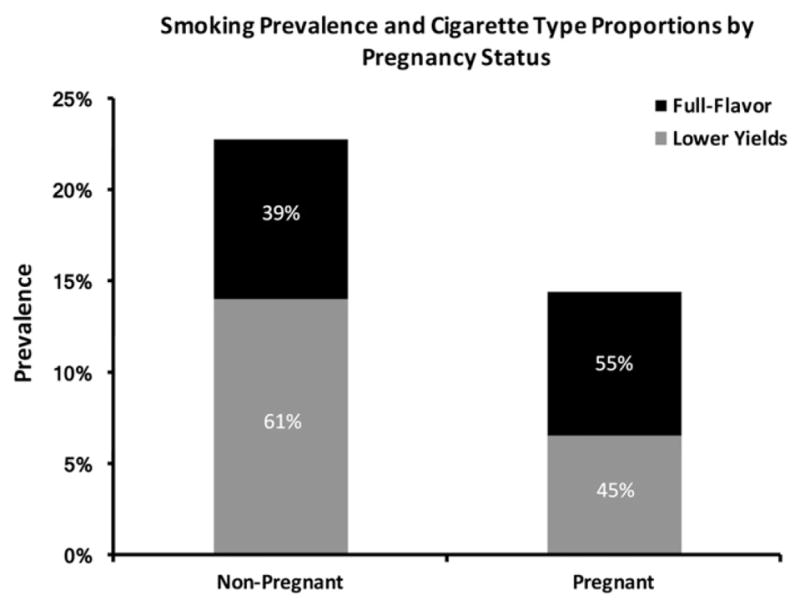
Fig. 1.

Bar graph showing prevalence of smoking among non-pregnant and pregnant women of reproductive age (15–44 years). Shown within each bar are the proportions of smokers whose usual brand of cigarette was machine-estimated full-flavor (black) versus a lower yield (gray).
The data source is the National Survey on Drug Use and Health (2005–2014).
