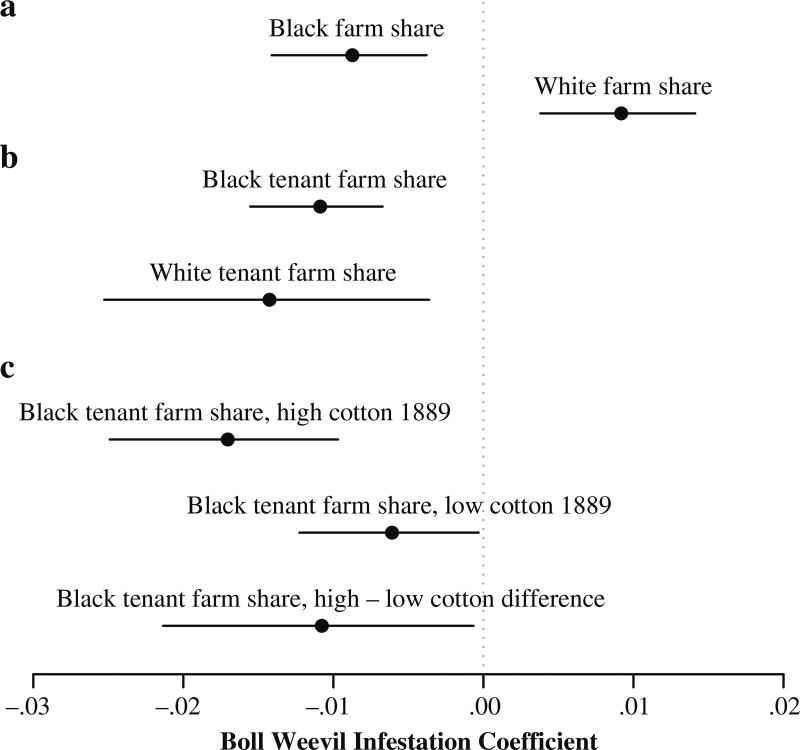
Fig. 5.
Coefficients on the boll weevil indicator predicting agricultural outcomes. All estimates are conditional on year and county fixed effects and time-varying county covariates. Dots depict point estimates, and bars depict 95 % confidence intervals. All standard errors are clustered by county. The sample includes southern counties that experienced the boll weevil infestation, excluding Oklahoma counties. Census and USDA data

