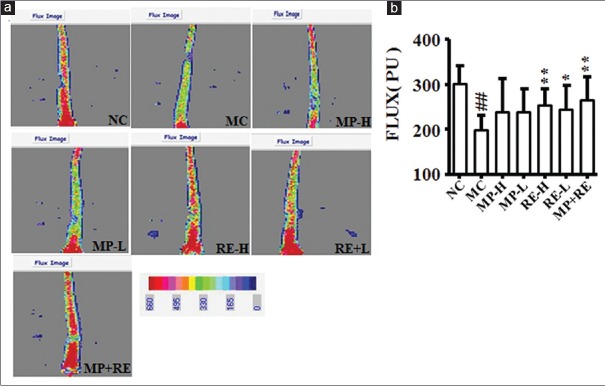
Figure 3.
Effect of RE and metoprolol on microcirculation. (a) Representative images of tails acquired by scanning Doppler perfusion imager. (b) Analysis laser of microvascular blood perfusion. Values are expressed as the mean ± standard deviation (n = 8).#P < 0.05,##P < 0.01 versus normal control group; *P < 0.05, **P < 0.01 versus MC group. RE: Paeoniflorin enriched extract from Radix Paeoniae alba; NC: Normal control; MC: Model control; MP-H: Metoprolol high dose (20 mg/kg, p.o.); MP-L: Metoprolol low dose (6 mg/kg, p.o.); RE-H: RE high dose (90 mg/kg, p.o.); RE-L: RE low dose (30 mg/kg, p.o.); MP + RE: metoprolol combined with RE (6 mg/kg + 30 mg/kg, p.o.)

