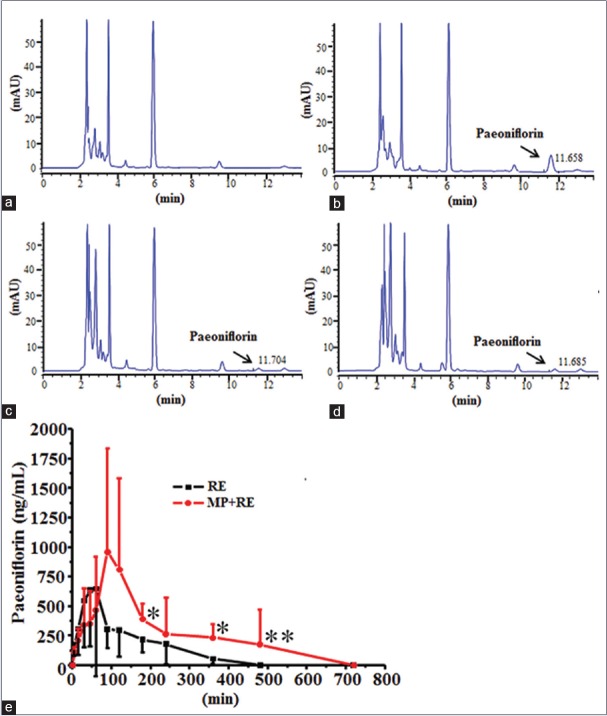
Figure 7.
Representative the chromatograms of paeoniflorin in rat plasma and mean plasma concentration-time profile of paeoniflorin in rat plasma. (a) blank plasma; (b) plasma spiked with paeoniflorin (3 μg/ml); (c) plasma sample obtained 30 min after oral administration with RE (30 mg/kg); (d) Plasma sample obtained 30 min after oral administration with MP + RE (6 mg/kg + 30 mg/kg); (e) Plasma concentration-time profiles of paeoniflorin after oral administration with RE (30 mg/kg) and MP + RE (6 mg/kg + 30 mg/kg), respectively. Values are expressed as the mean ± standard deviation (n = 5). *P < 0.05, **P < 0.01 versus administration with RE alone. RE: Paeoniflorin enriched extract from Radix Paeoniae alba; MP: Metoprolol

