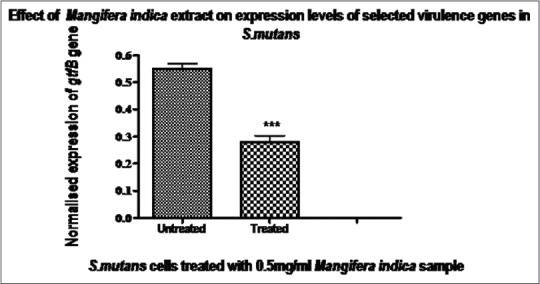
Figure 2.

Expression of the mRNA levels of the gtfB gene in treated and untreated cells. Expressions of the gtfB gene were normalized to that of the glnA reference gene. Data are expressed as mean ± standard deviation, n = 6, t-test, P < 0.05, represents a statistical significance when compared to the untreated. The plant sample caused a reduction in mRNA levels for this gene, indicating that the sample may have an effect on the synthesis of the glucotransferase enzyme at transcription level
