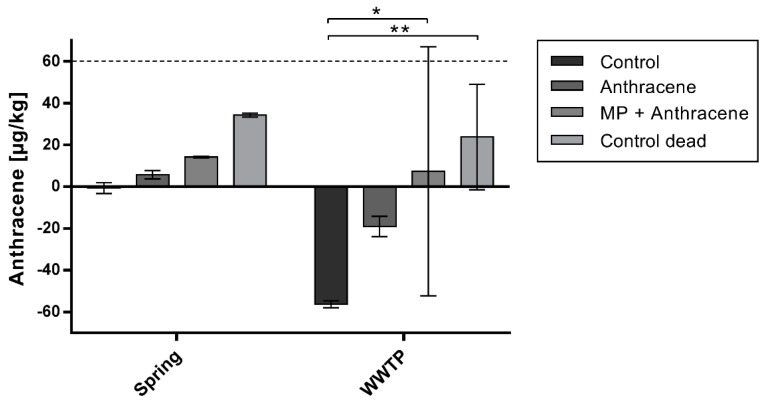
Figure 6.
Anthracene concentrations detected in the sediment after two weeks of incubation, minus the respective ambient background concentration of anthracene detected in the environmental sample. The spiked concentration of anthracene is displayed in the dashed line (60 µg/kg). Significant differences (two-way ANOVA; * p < 0.05, ** p < 0.01) were detected between the control group and the treatment with microplastic (MP) + Anthracene and the dead control. Even though high amounts of sodium azide were added to the dead control, anthracene was still degraded. Different treatments at the spring site were not significant using the two-way ANOVA due to the high variance at the wastewater treatment plant (WWTP).

