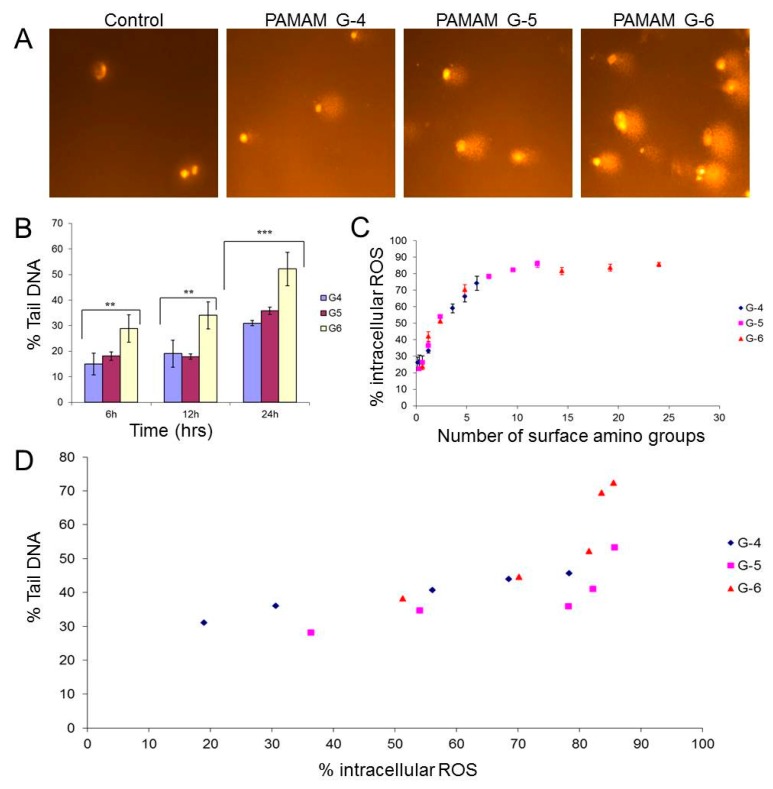
Figure 3.
(A) Representative micrographs showing comets of PLHC-1 cells after 24 h exposure to PAMAM dendrimers (G4, G5, and G6) at a dose of 0.5 µM concentration. (B) Generation dependent genotoxicity response of PAMAM dendrimers at 6, 12, and 24 h exposure at 0.5 µM concentration, as represented by the %Tail DNA measured by the comet assay. *** Significant difference of genotoxicity response between G4, G5 and G6 (p ≤ 0.05). ** Significant difference of genotoxicity response between G4, G6, and between G5, G6 (p ≤ 0.05). (C) Plot showing the relationship between the intracellular ROS production and the molar volume X number of surface amine groups at 2 h exposure time period of 0.6 µM concentration. (D) Relationship between DNA damage and intracellular ROS production upon exposure to PAMAM dendrimers G4, G5, and G6. Maximum DNA damage was observed at 24 h, and maximum ROS at 2 h. Figure reproduced with permission from reference [72].

