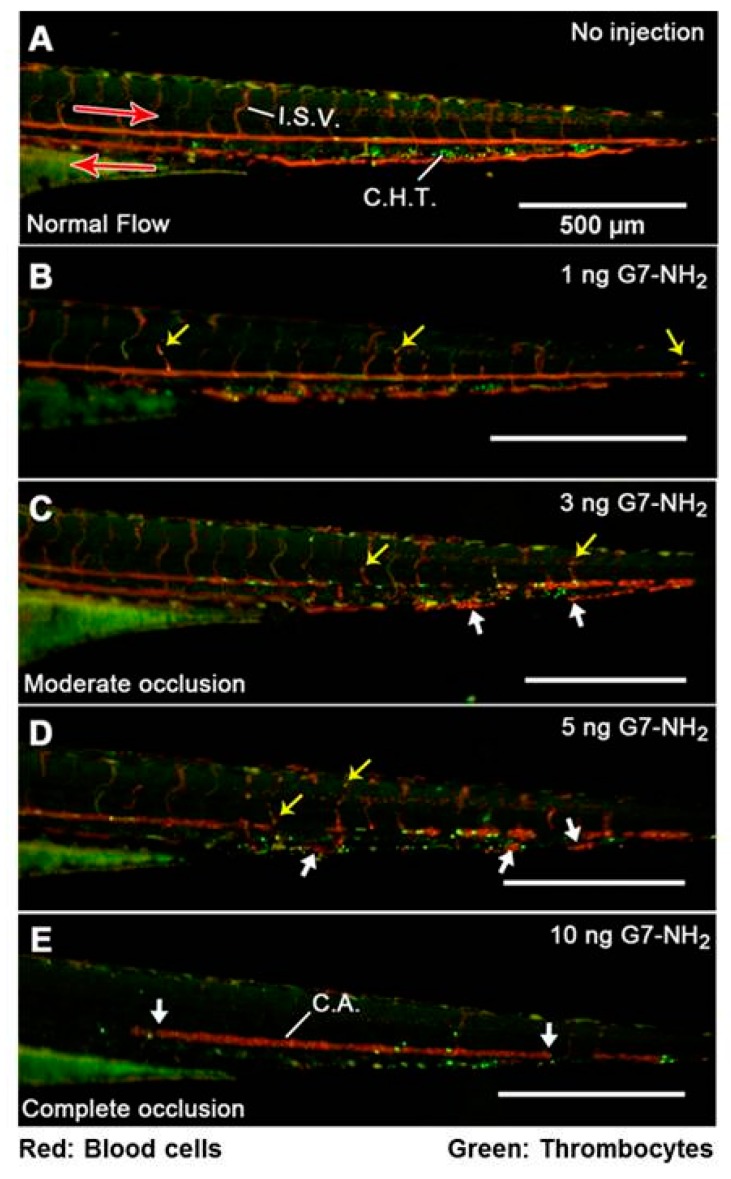
Figure 4.
Dose-dependent G7-NH2 occlusion in zebrafish embryos 1 min post injection. The top panel (A) depicts unperturbed caudal blood flow as streaks of red and green light visible in the major caudal artery (CA, left to right), vein (right to left), and intersegmental vessels. Punctate green and red spots in between the major caudal artery and vein indicate the location of the caudal hematopoietic tissue. Subsequent images (proceeding downward (B–E), with increasing G7-NH2 dose) depict increased cellular adhesion and vascular occlusion resulting from dendrimer injection, culminating in no visible blood flow following an injection of 10 ng of G7-NH2. The yellow arrows depict individual red blood cells trapped inside the vessel, while the large white arrows show significant blood clots inside the vessels. Notice in (E) that the caudal artery is completely occluded with no observable flow in the major caudal vein. Figure reproduced with permission from reference [140].

