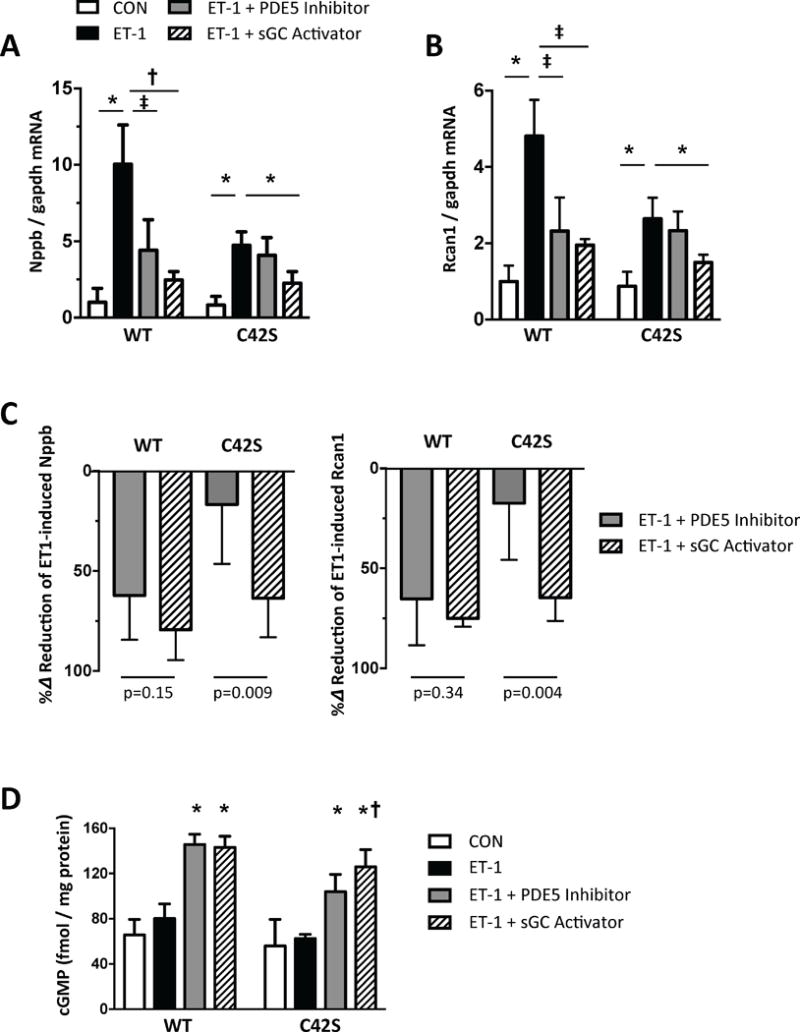
Figure 3. Disparity of drug response is observed in cells expressing PKG1αC42S.

A, B) Nppb and Rcan1 mRNA expression normalized to Gapdh in NRVMs stimulated with endothelin-1 (ET1) ± SIL (1 μM) or BAY602770 (1 nM). N=6/group; * p<0.001, † p=0.003, ‡ p=0.03. C) Percent reduction of Nppb or Rcan1 expression induced by ET-1 due to each drug treatment. N=6/group; p values for Mann-Whitney-U test. D) Myocyte cGMP in NRVMs at rest, and with ET-1 exposure with or without SIL or BAY co-treatment. Analysis by 2 way ANOVA; Genotype p<0.0001; Drug Intervention p<0.0001; interaction p=0.043. Post-hoc Sidak multiple comparisons: * p<0.0001 vs CON and ET-1; † p=0.05 vs PDE5-I in C42S group.
