
Figure 5.
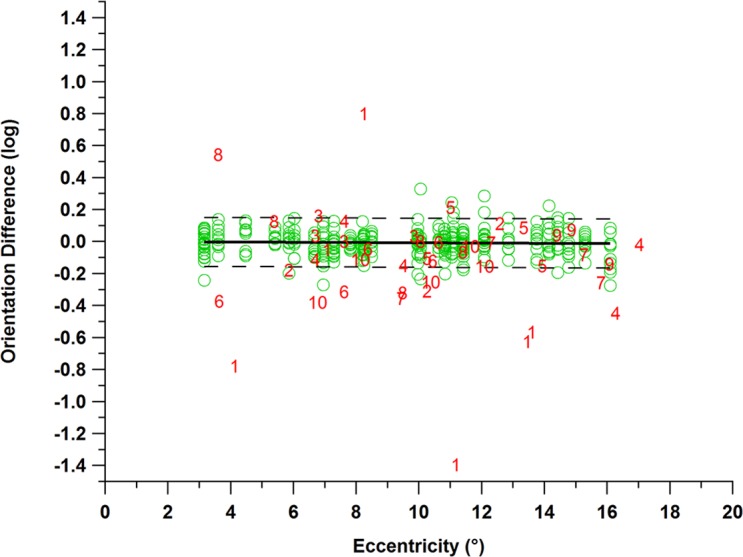
Results for the second hypothesis regarding orientation differences for age-similar controls (green circles) and for patients with glaucoma (red numbers). Dashed lines show the upper and lower limits of the 95% reference range, and the bold line represents the mean. It can be observed that 14 of 44 locations had abnormal orientation differences in patients with glaucoma (red numbers).