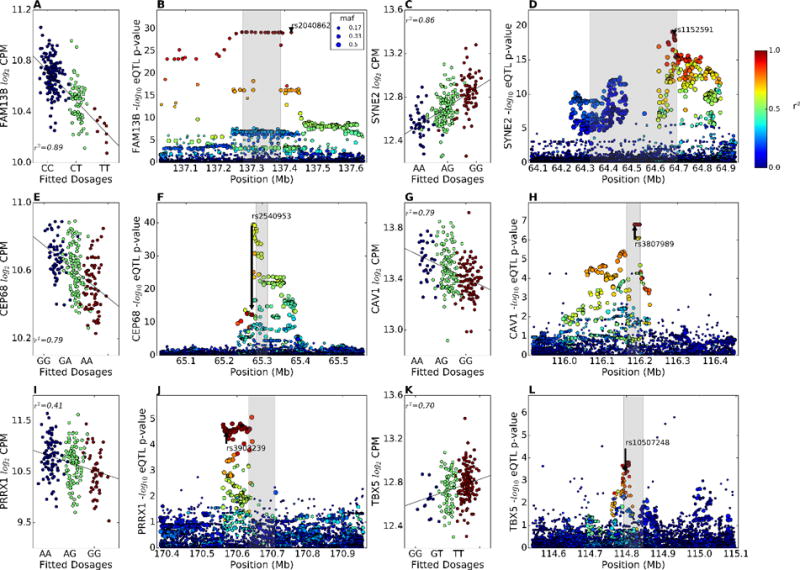
Figure 3.

Cis-eQTLs for GWAS genes. (A, C, E, G, I, K) Partial regression plot showing the effect of the AF GWAS SNPs rs2040862, rs1152591, rs2540953, rs3807989, rs3903239, and rs10507248 on the LA expression of the FAM13B, SYNE2, CEP68, CAV1, PRRX1, and TBX5 genes in European descent subjects after adjusting for genetic MDS, transcription SVAs, and gender. Blue dots are subjects homozygous for the reference allele (GRCh37 build), green dots are heterozygotes, and red dots are homozygous for the variant allele. (B, D, F, H, J, L) eQTL p-values and LD relationship (color scale) with the GWAS SNP (arrow) in the 0.5 Mb region around the TSS of the FAM13B, SYNE2, CEP68, CAV1, PRRX1, and TBX5 genes in European subjects.
