Figure 1.
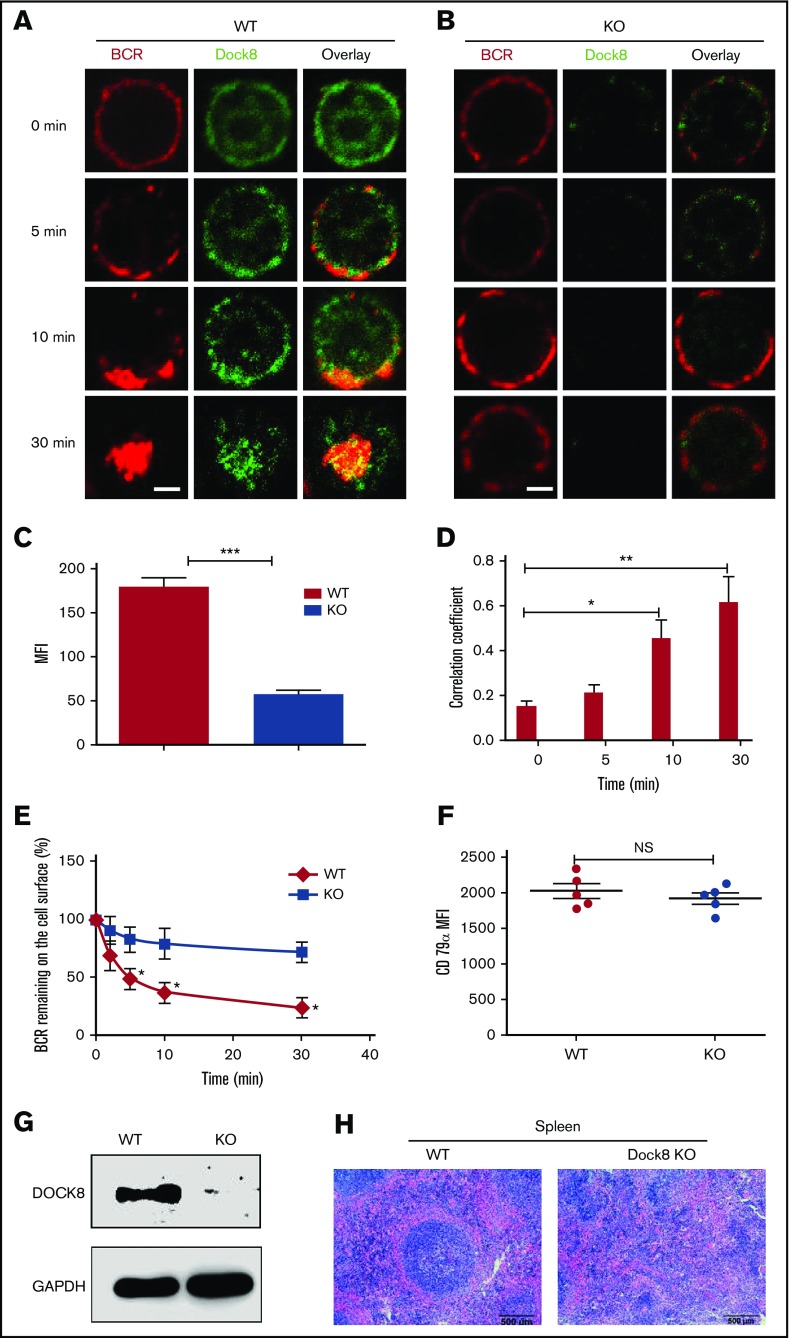
Dock8 is involved in BCR activation and internalization. We incubated murine splenic WT or Dock8 KO B cells with AF546–mB-Fab′–anti-Ig, to mimic sAg, for 10 minutes at 4°C to label the BCR. Then, the cells were incubated either with streptavidin or with the medium alone (0 minutes) as a control at 37°C for varying lengths of time. (A-B) After fixation and permeabilization, the cells were stained for Dock8 and analyzed using confocal microscopy (CFm). (C) The expression levels of Dock8 in WT and KO B cells quantified using NIS-Elements AR 3.2 software. (D) The correlation coefficient between BCR and Dock8 was quantified using NIS-Elements AR 3.2 software. Shown are representative images in which more than 50 cells were individually analyzed using NIS-Elements AR 3.2 software; mean values (±SD) are from 3 independent experiments. (E) Flow cytometry analysis of BCR internalization by quantifying the percentage of biotin-F(ab′)2–anti-Ig–labeled BCR remaining on the cell surface after the 37°C chase. Shown are the average percentages (±SD) from 3 independent experiments. (F) Flow cytometry analysis of BCR intensity of splenic WT or Dock8 KO B cells. (G) Western blot of Dock8 from the splenocytes of WT and Dock8 mice; glyceraldehyde-3-phosphate dehydrogenase was used as a loading control. (H) Hematoxylin and eosin staining of spleen from WT and Dock8 KO mice (19-23 weeks old). Scale bars, 2.5 μm. *P < .01; **P < .001; ***P < .0001. NS, not significant.

