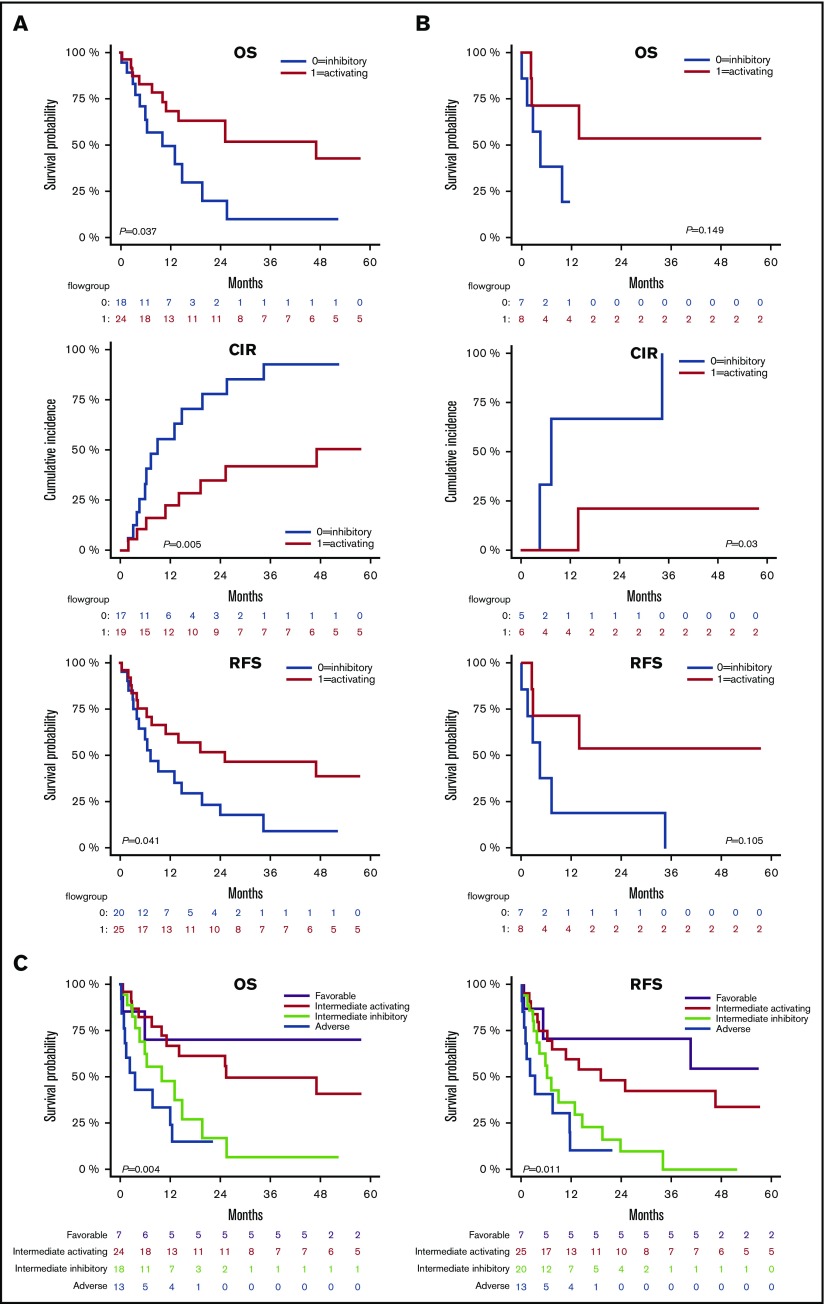
Figure 5.
NKRL groups stratify patients with intermediate prognosis. Only patients belonging to the intermediate cytogenetic (A) and intermediate molecular risk according to ELN criteria32 (B) were analyzed for OS, CIR, and RFS. Patients belonging to group 0 and 1 are represented by blue and red lines, respectively. (C) Patients were stratified by cytogenetic prognosis, and subjects with intermediate cytogenetic risk were further classified according to their NKRL group: purple line corresponds to favorable cytogenetics; red line corresponds to intermediate cytogenetics and NKRL group 1 (activating pattern); light green line defines intermediate cytogenetics and NKRL group 0 (inhibitory pattern); blue line corresponds to adverse cytogenetics. Kaplan-Meier estimates for OS (left panel) and RFS (right panel) are shown. P values are shown.

