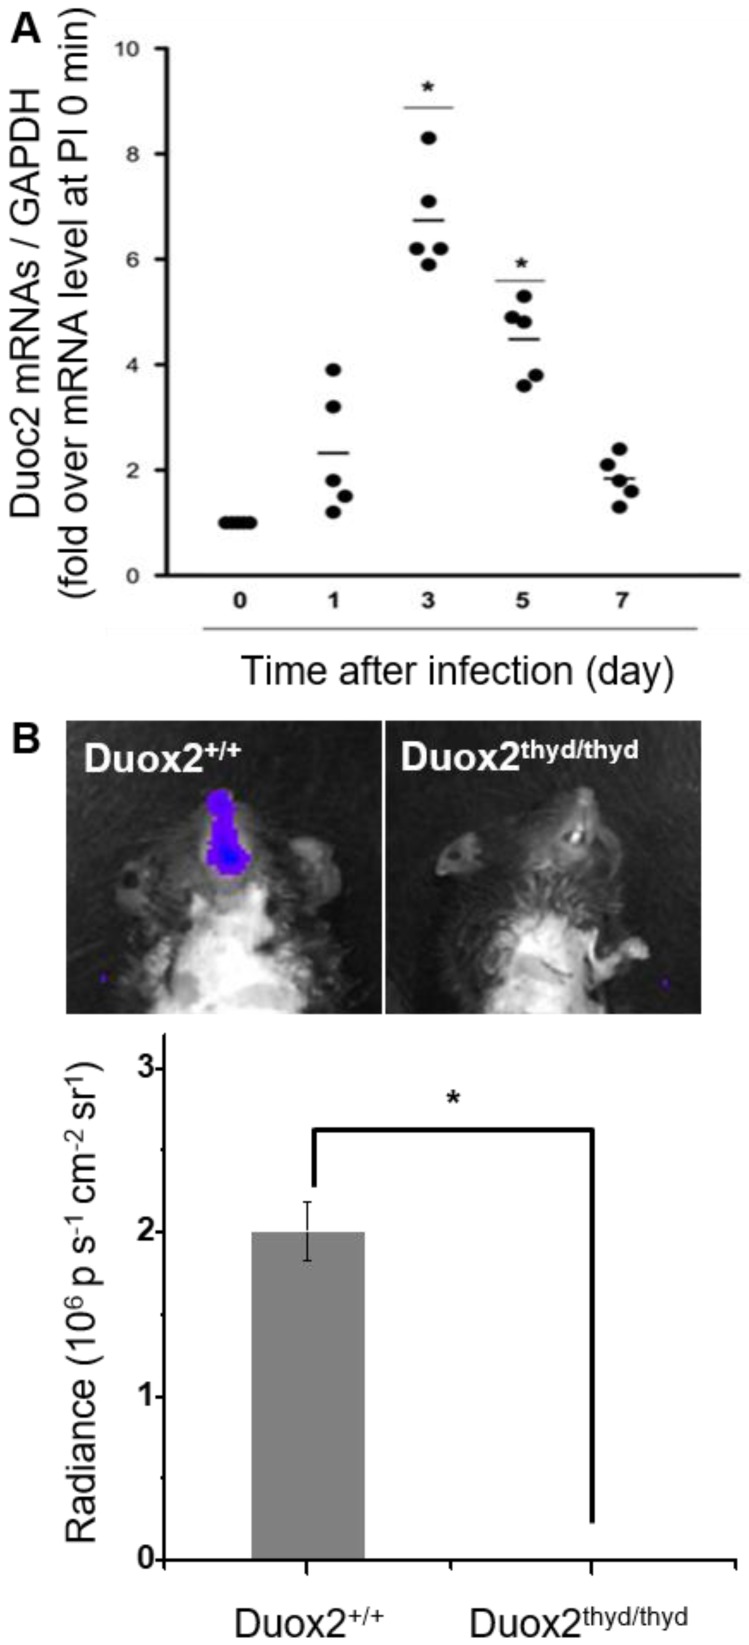
Figure 5.
(A) Real-time PCR monitoring of Duox2 mRNA level in the nasal mucosa of WT mice (n=5) at the indicated time points after infection (dpi) with 213 pfu IAV WS/33 (H1N1). Results are presented as the mean values (*: p<0.05 when compared to the same mice at 0 dpi). (B) CL images (left) and the corresponding CL intensities (right) of BioNT in the nasal mucosa of WT mice (Duox2+/+) and Duox2-knockout mutant mice (Duox2thyd/thyd), both of which were infected with 213 pfu IAV WS/33 (H1N1). CL imaging was performed at 3 dpi and CL intensities are presented as the mean ± standard deviation (*: p < 0.05, n=5).

