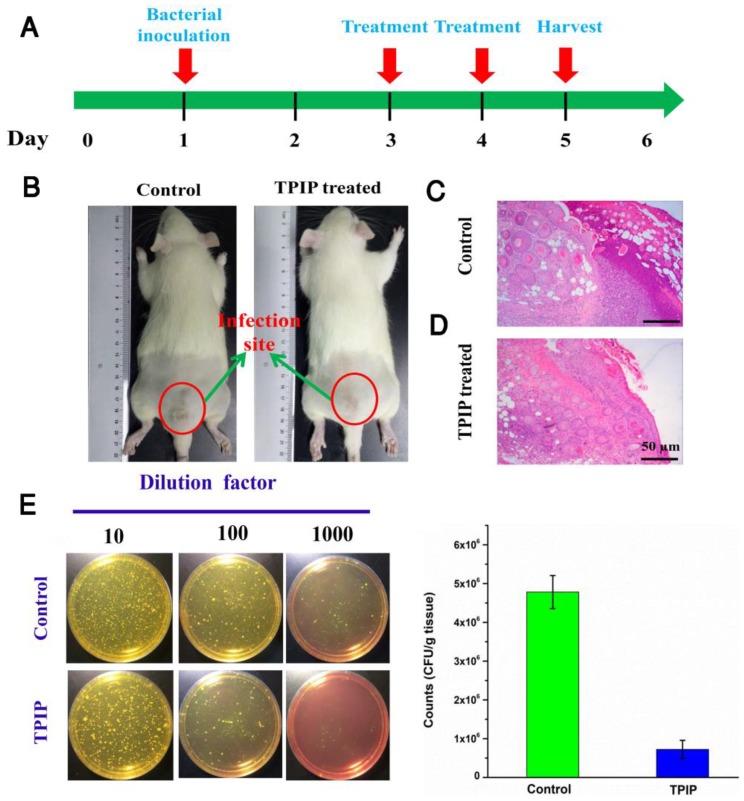
Figure 6.
(a) The schematic diagram of S. aureus-infected rat model and the therapeutic evaluation TPIP-FONs. (b) Photographs of S. aureus-infected rat treated with PBS (control) or TPIP-FONs solution. (c & d) Histological images of the skin from the control group and from the group treated with TPIP-FONs. (e) Photographs of the bacterial colonies and corresponding statistical histogram derived from the homogenized tissue dispersion of the infected sites injected with PBS and TPIP-FONs. The tissue dispersions were diluted (10, 100 and 1000 times) and plated on mannitol high salt agar medium at 37 °C for 12 hours.

