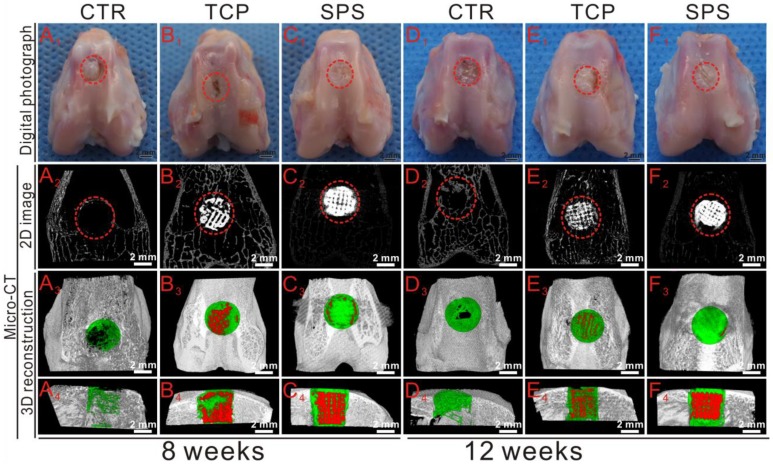
Figure 10.
The overall photographs and Micro-CT imaging analysis of the defects at 8 and 12 weeks post-surgery. (A1-F1) The gross morphology of the defects, (A2-F2) 2D projection images of the defects, (A3-F3) and (A4-F4) showed the transverse view and sagittal view of 3D construction images. In 2D projection images, the off-white color and white color stand for primary bone and scaffolds, respectively. In 3D reconstruction images, the off-white color, green color and red color stand for primary bone, new bone and scaffold, respectively. As compared to CTR and TCP groups, Micro-CT analysis of defect space exhibited distinctly greater level of bone formation in the SPS group.

