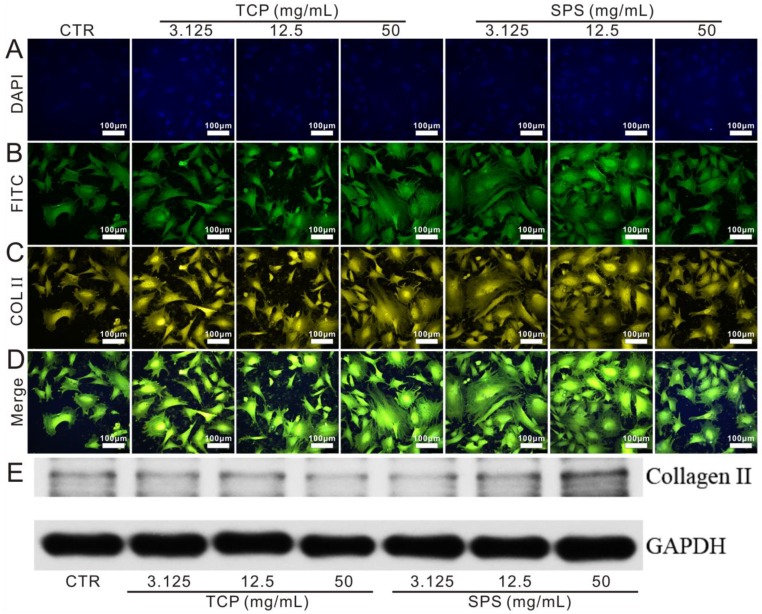
Figure 4.
The expression of COL II protein in chondrocytes cultured with TCP and SPS extracts. (A) DAPI, (B) FITC, (C) COL II, (D) merge images, (E) western blot. The expression of COL II protein was enhanced significantly in SPS group (50 mg/mL) as compared to TCP and CTR groups. CTR stands for blank control.

