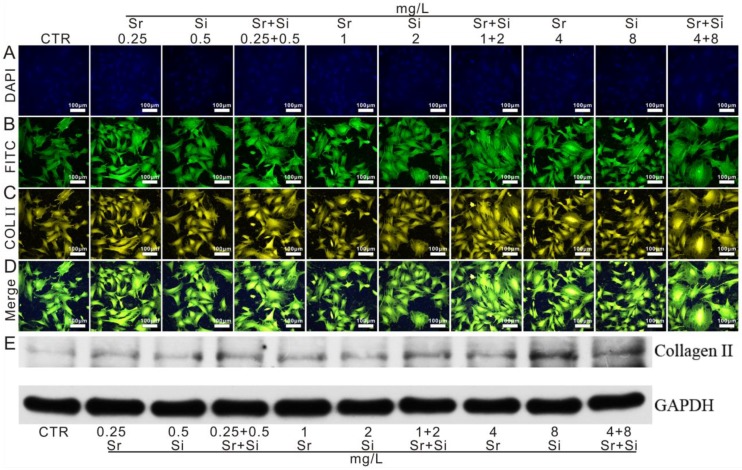
Figure 6.
The expression of COL II in chondrocytes cultured with different concentrations of Sr and/or Si ions. (A) DAPI, (B) FITC, (C) COL II, (D) merge images, (E) western blot. COL II protein expression in chondrocytes elevated distinctly cultured with Sr (0.25-4 mg/L) or Si (0.5-8 mg/L) as compared to the CTR group. Furthermore, Sr and Si together promoted COL II protein expression within the concentration range of Sr 0.25-1 mg/L and Si 0.5-2 mg/L. CTR stands for blank control.

