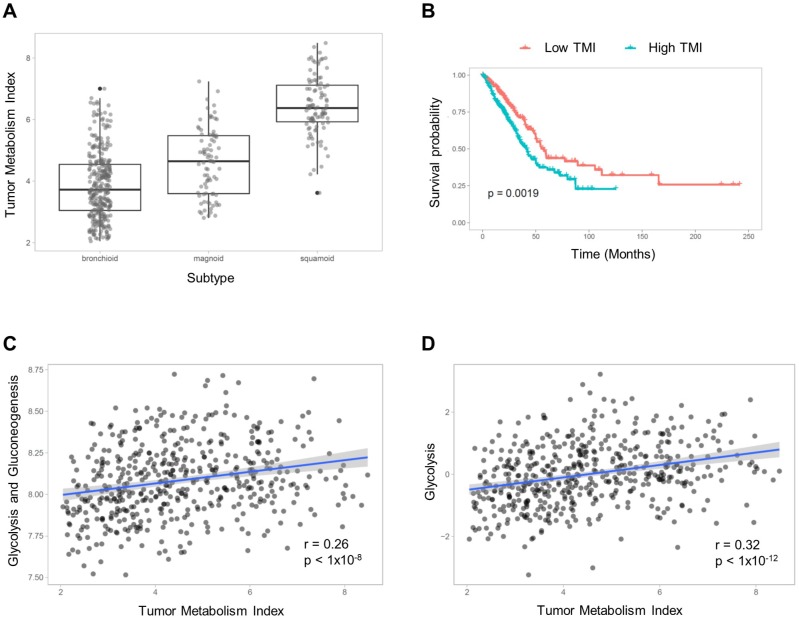
Figure 1.
Tumor metabolism index (TMI) estimation model. (A) The subjects were classified into three LUAD subtypes, and TMI was compared between subtypes. There was a significant effect of the subtypes on TMI (F = 211.7, p < 1×10-15; 3.87±1.09 vs. 4.60±1.11 vs. 6.45±0.96 for TMI of bronchioid, magnoid and squamoid subtypes, respectively). (B) The subjects were divided into two groups based on the median value of TMI, and the group with high TMI showed significantly worse prognosis (p = 0.0019). TMI was compared with gene signatures representing glucose metabolism. (C) The mean gene expression values of selected genes related to glycolysis and gluconeogenesis showed a positive correlation with TMI. (D) The glycolysis enrichment score calculated by gene sets of Reactome was also positively correlated with TMI.

